
This article breaks down what each Cpk level really means in terms of sigma levels, defect rates, and practical risk, so you can set capability targets with confidence instead of habit.
A Cpk of 1.33 is a four sigma process (≈ 63 defective parts per million), a Cpk of 1.67 is a five sigma process (< 1 PPM), and a Cpk of 2.00 is a six sigma process (≈ 2 parts per billion short-term, or 3.4 PPM after the assumed 1.5σ long-term shift). Cpk 1.33 is the common minimum for ongoing production; 1.67 is required for critical characteristics and new launches; 2.00 defines a six sigma process.
Three numbers appear over and over in process capability analysis: 1.33, 1.67, and 2.00. You will find them in customer specifications, supplier quality agreements, PPAP submissions, and audit checklists across virtually every industry.
What Cpk Actually Measures
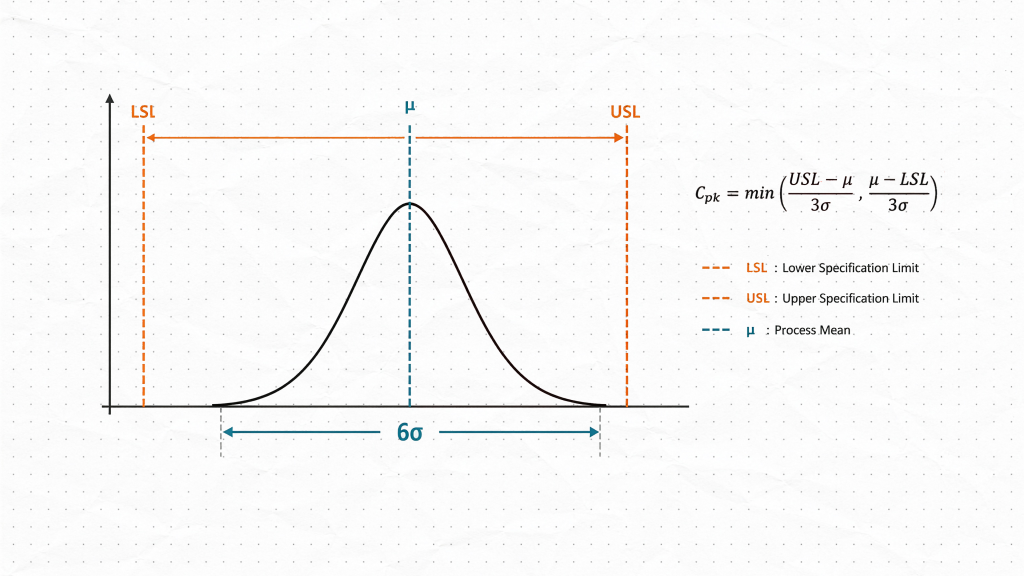
Cpk measures how well your process fits inside the specification limits while accounting for centering. It takes the distance from the process mean to the nearest specification limit and divides it by three standard deviations:
Cpk = min ( (USL − μ) / 3σ , (μ − LSL) / 3σ )
A higher Cpk means more breathing room between your process variation and the point where parts become defective. Unlike Cp, Cpk penalizes an off-center process — that distinction is covered in detail in the difference between Cp and Cpk. Every threshold discussed in this article is simply a statement about how much of that breathing room your customer expects.
What is PPM?
PPM stands for parts per million — a way of expressing defect rates on a common scale. A PPM of 63 means that out of every one million parts produced, roughly 63 are expected to fall outside the specification limits. The lower the PPM, the fewer defects escape your process.
PPM = (Defective Parts / Total Parts) × 1,000,000
As Cpk increases, the tail of the normal distribution beyond the specification limit shrinks, and the PPM value drops with it.
Cpk = 1.33: The Four Sigma Floor
A Cpk of 1.33 corresponds to a four sigma process: the nearest specification limit sits four standard deviations away from the process mean. In the short term, that translates to a defect rate of roughly 63 parts per million.
Cpk = 1.33 process capability chart — the nearest specification limit (USL) sits 4σ from the mean; expected defect rate ≈ 63 PPM
This is the most common minimum requirement in manufacturing, and for good reason. Compared with a barely capable process (Cpk = 1.00, or three sigma), it provides a full extra sigma of buffer. That buffer absorbs small shifts in the mean — from tool wear, material variation, or setup differences — before defects begin to appear.
For most general-purpose characteristics, Cpk 1.33 is the accepted floor for ongoing production.
Cpk = 1.67: The Five Sigma Requirement
A Cpk of 1.67 raises the bar to five sigma, cutting the expected defect rate to under one part per million.
Cpk = 1.67 process capability chart — reduced variation puts the USL 5σ from the mean; expected defect rate < 1 PPM
You will see this requirement on safety-critical or high-consequence characteristics, and it is the common expectation for new process launches in automotive under PPAP, where a Ppk of 1.67 is typically demanded before production approval.
The logic is simple: new processes have not yet demonstrated long-term stability, and critical features cannot tolerate the risk that a modest mean shift would create at lower capability levels. The extra sigma of margin is insurance against the unknown.
Cpk = 2.00: The Six Sigma Definition
A Cpk of 2.00 is the literal definition of a six sigma process: the nearest specification limit is six standard deviations from the mean, and the short-term defect rate drops to about two parts per billion.
Cpk = 2.00 process capability chart — the six sigma process: the USL sits 6σ from the mean; short-term defect rate ≈ 2 PPB
Isn't Six Sigma 3.4 Defects per Million?
You have probably heard six sigma linked to a different number: 3.4 defects per million. So why the gap between two parts per billion and 3.4 parts per million?
Because the six sigma concept assumes a long-term 1.5 sigma shift in the process mean. Over months of production, tooling, materials, and operators drift the process center. That shift turns a short-term Cpk of 2.00 into a long-term Ppk of 1.50 — the distinction between short-term and long-term indices is explained in Cpk vs Ppk — and it is this long-term Ppk of 1.50 that produces the famous 3.4 defects-per-million figure.
Short-term Cpk = 2.00 → apply the 1.5σ shift → long-term Ppk = 1.50 → 3.4 PPM.
The Cpk Thresholds
| Cpk | Sigma Level (short-term) | Expected Defect Rate | Typical Use |
|---|---|---|---|
| 1.33 | 4σ | ≈ 63 PPM | General characteristics, ongoing production |
| 1.67 | 5σ | < 1 PPM | Safety-critical features, new launches (PPAP) |
| 2.00 | 6σ | ≈ 2 PPB short-term (3.4 PPM with 1.5σ shift) | Six sigma programs, extreme failure cost |
Notice the pattern: each step of one third in Cpk adds a full standard deviation of margin. That extra sigma is not about the defects you see today. It is insurance against tool wear, material lot changes, and operator variation that will shift your mean over time.
Which Cpk Target Should You Use?
Match the requirement to the consequence of failure:
| Situation | Recommended Target |
|---|---|
| General characteristics in stable production | Cpk ≥ 1.33 |
| Critical characteristics, new launches, safety or regulatory features | Cpk ≥ 1.67 |
| Six sigma programs; extreme downstream failure cost | Cpk ≥ 2.00 |
And a word of caution in the other direction: chasing a higher Cpk than the risk justifies ties up capital in tighter tolerances, more expensive equipment, and slower cycle times.
Capability targets are engineering decisions, not trophies.
Frequently Asked Questions
What is a good Cpk value?
For most manufacturing processes, a Cpk of 1.33 or higher is considered good — it is the widely accepted minimum for ongoing production. Critical or safety-related characteristics typically require 1.67 or higher, and 2.00 represents six sigma capability. A Cpk below 1.00 means the process is producing defects and needs immediate attention.
Why is Cpk 1.33 the standard minimum instead of 1.00?
A Cpk of 1.00 means the specification limit sits exactly three sigma from the mean — any shift in the process immediately produces defects. Cpk 1.33 adds a full sigma of buffer, so the process can absorb small, inevitable shifts before nonconforming parts appear.
Why does PPAP ask for Ppk 1.67 instead of Cpk 1.67?
At launch, a process has little history, so overall (long-term) variation is the more honest measure of what the customer will actually receive. Ppk uses overall standard deviation, making it the appropriate index for initial process approval before long-term stability has been demonstrated on a control chart.
Where does the 3.4 defects per million figure come from?
It comes from combining a short-term six sigma process (Cpk = 2.00) with the assumed long-term 1.5 sigma shift of the mean. The shifted process is equivalent to a long-term Ppk of 1.50, which corresponds to about 3.4 defects per million opportunities.
Is a higher Cpk always better?
Not economically. Beyond the level justified by the consequence of failure, additional capability costs money — tighter tolerances, better equipment, slower production — without a proportional reduction in real risk. Set the target based on what a defect would actually cost downstream.
Calculate Cpk and Ppk on Your Own Data
If you want to see where your own process stands, Cpk Calculator is a free, web-based capability analysis module — no installation required. Paste in your data and instantly see Cp, Cpk, Pp, and Ppk, along with the expected defect rate your capability values imply.