A practical guide to standard deviation — what it measures, why it matters, and the difference between population and sample standard deviation explained with clear examples.
Standard deviation is one of the most important concepts in statistics. It appears in manufacturing quality control, finance, healthcare, scientific research, and virtually any field where data needs to be understood. Yet despite its widespread use, the concept is often explained in ways that feel abstract or overly mathematical.
This guide breaks it down step by step — what standard deviation actually measures, how to calculate it, and why there are two different versions of the formula.
What Is Standard Deviation?
Imagine measuring the heights of a group of people. The first thing most people calculate is the average — add everyone’s height together and divide by the number of people. This gives us the mean, or average height of the group.
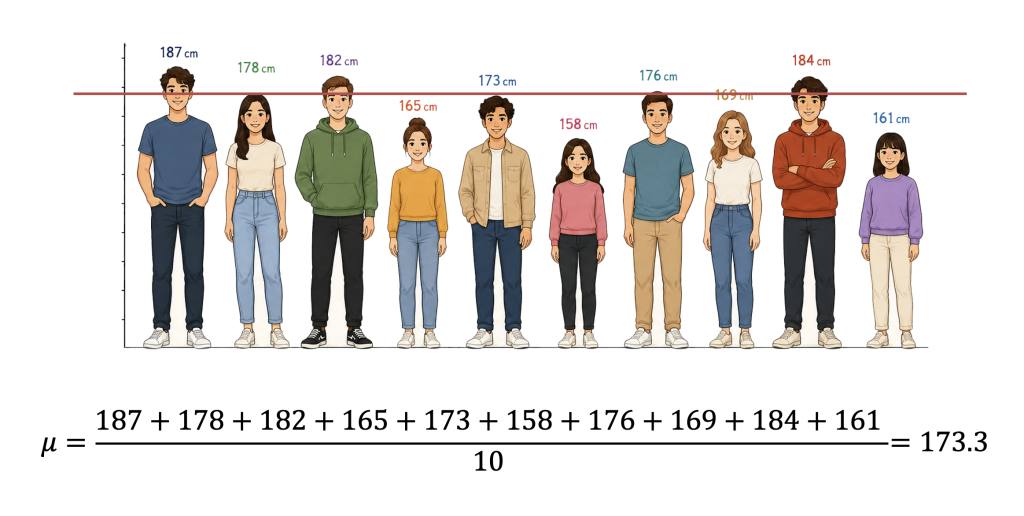
In this example, the mean height is 173.3 cm. Some people are taller than this average, and others are shorter. But the average alone does not tell us how spread out those heights actually are. Two groups of people can have exactly the same average height while being completely different in how consistent or variable they are.
That is exactly what standard deviation measures:
Standard deviation measures how spread out or dispersed a set of measurements is around its mean.
You can also think of it as a measure of consistency:
- A small standard deviation means the data points tend to be close to the mean and to one another.
- A large standard deviation means the data points are spread out over a wider range of values.
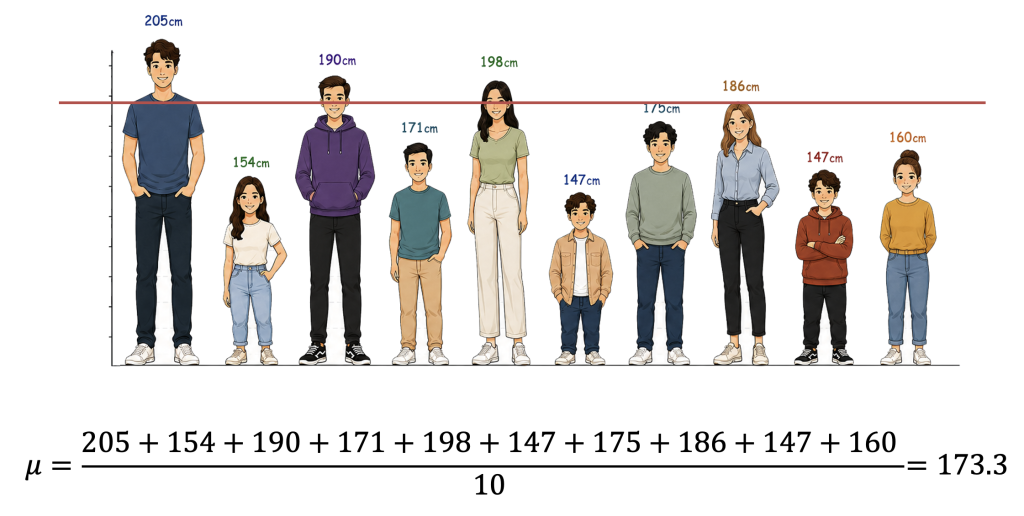
Consider another groups of people, both with a mean height of 173.3 cm. In the first group, most heights are clustered closely around the average. In the second group, the heights are far more spread out — some people are much taller, others much shorter. When standard deviation is calculated for both groups, the second group produces a value nearly twice as large, because the heights vary much more. The average is identical, but the spread is completely different.
How Standard Deviation Is Calculated
The calculation follows a logical sequence. For a population, the steps are:
- Subtract the mean (
μ) from each individual measurement to find the difference. - Square each of those differences.
- Add all the squared differences together.
- Divide the total by the population size (
N). - Take the square root of the result.
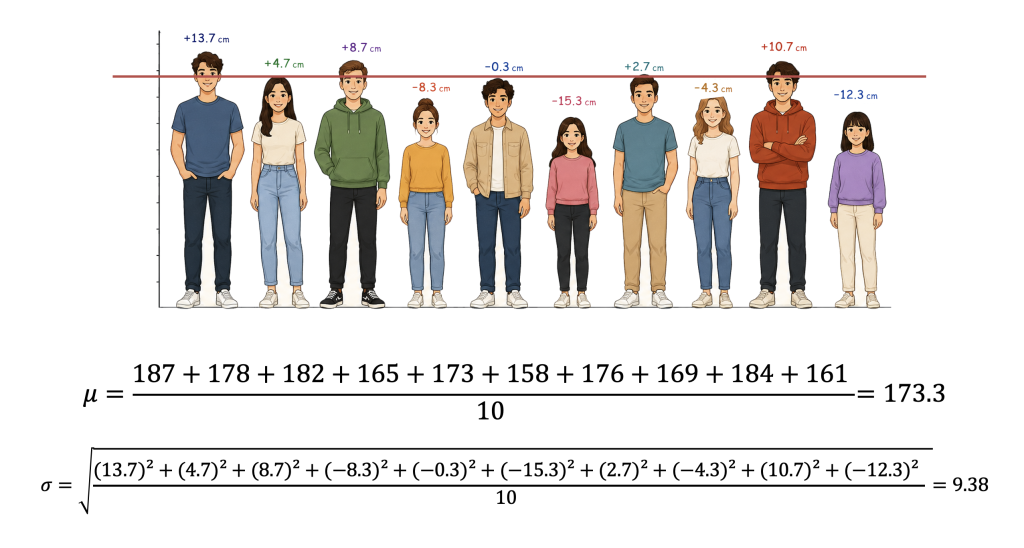
This sequence — squaring the differences, averaging them, and then taking the square root — is known as the root mean square. The result is the population standard deviation.
In the height example above, this calculation gives a standard deviation of 9.38 cm. That means the typical height in the group falls within roughly 9.38 cm of the mean in either direction.
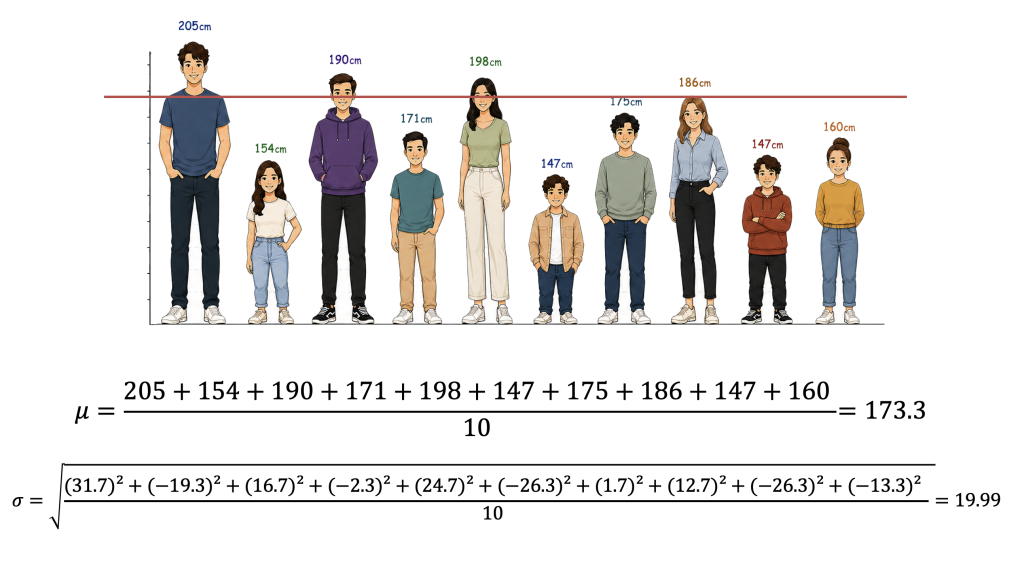
But for the second group, same calculation of standard deviation falls roughly 19.99cm.
Population vs. Sample Standard Deviation
One of the most common points of confusion in statistics is why there are two different standard deviation formulas. The answer comes down to a practical reality of data collection.
When You Have the Entire Population
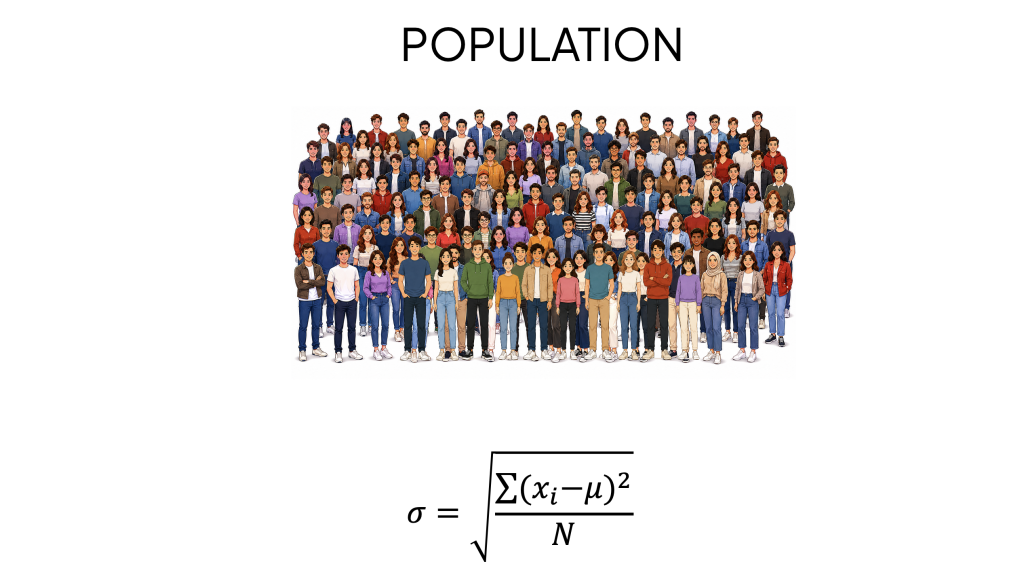
Imagine a town with 100 people. If you measure the height of all 100 people, you are working with the entire population. In this case, the population size is represented by N, and you can calculate the exact population standard deviation directly using the formula described above.
When You Are Working With a Sample
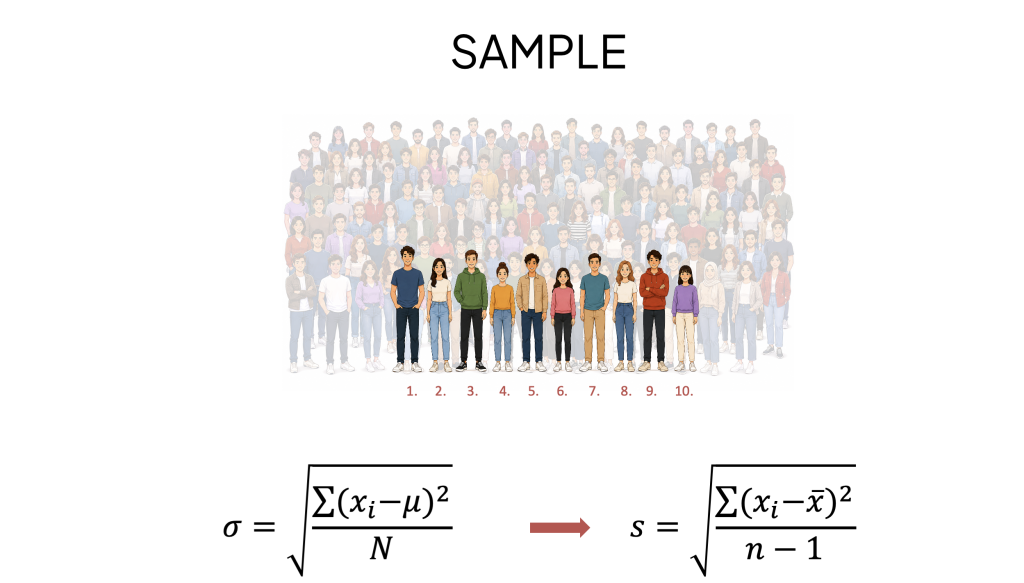
In many real-world situations, collecting data from an entire population is expensive, time-consuming, or simply impossible. Instead, a smaller group — a sample — is selected and used to estimate the behaviour of the wider population.
For example, rather than measuring all 100 people in the town, you might randomly select 10. The formula for sample standard deviation is slightly different from the population version: instead of dividing by n (the sample size), you divide by n − 1.
Why Divide by n − 1?
When using a sample, you are estimating the population’s variability rather than measuring it directly. A sample tends to slightly underestimate the true variability of the full population. Dividing by n − 1 — a correction known as Bessel’s correction — compensates for this bias by slightly increasing the calculated standard deviation, making it a more accurate and less biased estimate of the true population variability.
As a result, the sample standard deviation is always slightly larger than the population standard deviation calculated from the same data. This is expected and intentional.
Population vs. Sample: Key Differences
| Population Standard Deviation | Sample Standard Deviation | |
|---|---|---|
| Symbol | σ (sigma) | s |
| Divides by | N (population size) | n − 1 (Bessel’s correction) |
| Use when | You have data for the entire population | You have a sample and are estimating the population |
| Result | Exact population variability | Slightly larger — corrected estimate |
Why Standard Deviation Matters in Practice
In many real-world processes, measurements naturally cluster around the average, with fewer observations at the extremes. Think of the heights of students in a classroom — most are close to the average, while very short or very tall students are less common. Standard deviation quantifies exactly how tight or spread out that clustering is.
In manufacturing, a small standard deviation is generally preferred because it means products are being produced consistently with less variation. Greater consistency leads to higher quality and fewer defects. Standard deviation is a core metric in process capability analysis and quality control for this reason.
Beyond manufacturing, standard deviation is widely used in:
- Finance and investment analysis — measuring the volatility or risk of an asset
- Healthcare and medical research — understanding variation in patient outcomes
- Scientific studies — reporting the spread of experimental results
- Business performance measurement — tracking consistency of key metrics over time
Whenever variability, consistency, or risk needs to be understood, standard deviation provides meaningful insight.
With SIGMADESK’s Process Capability Analysis tool, both values are calculated and displayed automatically alongside a histogram of your data — no manual formula work required. You can create a free account and try it with your own dataset straight away.
Leave a Reply