A practical guide to the Western Electric Rules — what they are, how they work, and how they help detect hidden process problems in control charts before they become serious.
Control charts are one of the core tools used in Statistical Process Control (SPC). They are widely used in engineering, manufacturing, and any other field where data is collected over time. But plotting data on a control chart is only the first step — the real power comes from knowing how to read the signals hidden within it.
That is exactly what the Western Electric Rules are designed for. They provide a structured set of decision rules for detecting abnormal patterns in a process — even when no point has yet crossed a control limit.
Common Cause vs. Special Cause Variation
Before exploring the rules themselves, it is important to revisit a fundamental concept in SPC: the difference between common cause variation and special cause variation.
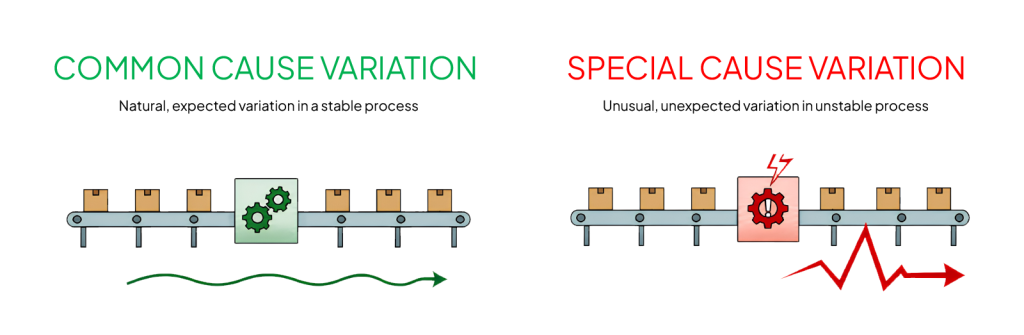
- Common cause variation is the natural, expected variation of a stable process — small pressure fluctuations, slight differences in cycle time, or normal delivery variations. These are simply part of how the process normally behaves.
- Special cause variation is different. It represents unusual, unexpected signals that indicate something in the process has changed — for example, a machine beginning to malfunction, a tool becoming worn out, an operator changing a setting, or a shift in raw material quality.
The goal of SPC is to detect special causes as early as possible. That is precisely where the Western Electric Rules become extremely useful — they help identify abnormal variation patterns before the process develops into a major problem.
The Control Chart Foundation
The Western Electric Rules are applied directly to control charts. A control chart has two main axes: the Y-axis, which represents the measured values, and the X-axis, which typically represents time or the sequence order of the data. Each measurement is plotted as an individual point and connected by lines so that process behaviour can be visualised clearly over time.
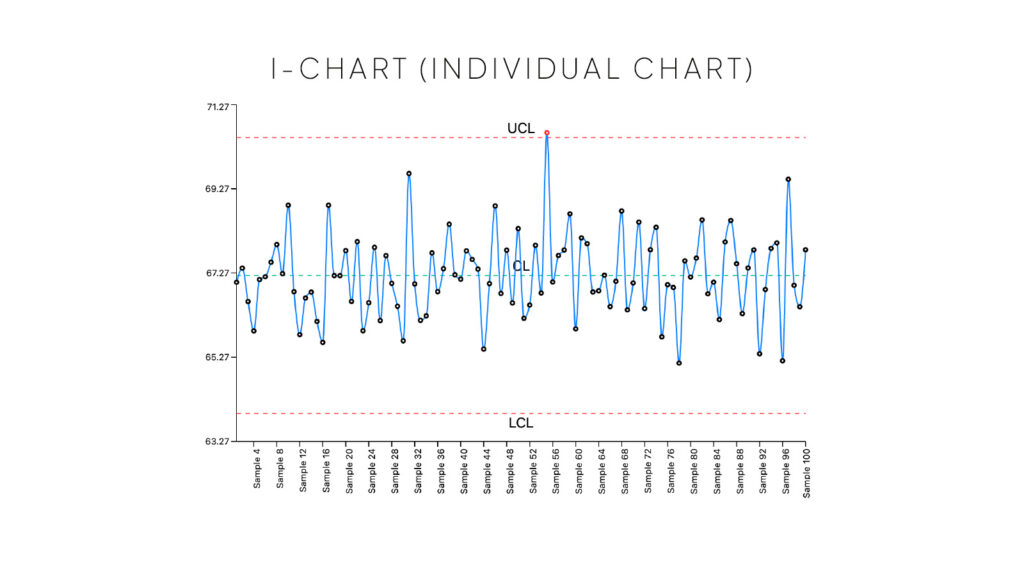
The Western Electric Rules can be applied to both I-Charts (Individual Charts), where each point represents a single measurement, and X̄ Charts (Xbar Charts), where each point represents a subgroup average. If you need a deeper introduction to control chart types and how they are constructed, the full control chart guide covers this in detail.
Sigma Zones
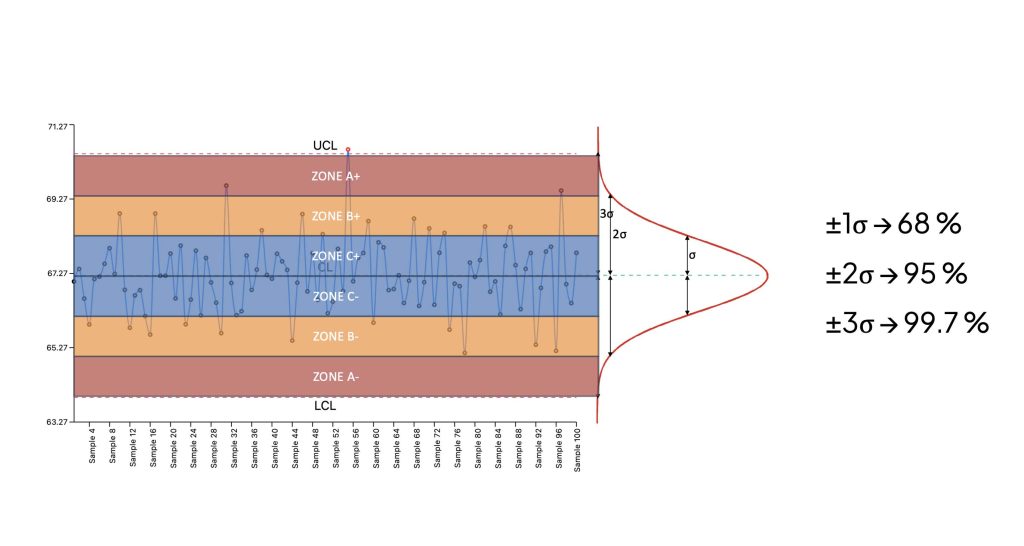
To understand the Western Electric Rules, you first need to understand sigma zones. These zones are based on the normal distribution, also known as the bell curve. In a normal distribution:
- About 68% of all values fall within ±1 standard deviation (one sigma)
- About 95% fall within ±2 sigma
- About 99.7% fall within ±3 sigma
Because values outside three sigma are statistically very unlikely in a stable process, the control limits on a control chart are typically set at ±3 sigma. The chart is then divided into three zones on each side of the centre line:
- Zone C — between the centre line and ±1 sigma
- Zone B — between ±1 sigma and ±2 sigma
- Zone A — between ±2 sigma and ±3 sigma (the control limits)
These sigma zones form the foundation on which the Western Electric Rules are built.
What Are the Western Electric Rules?
The Western Electric Rules are a set of decision rules used with control charts to detect non-random patterns in a process. Their key strength is this:
A process can start drifting long before a point actually crosses the control limit. The Western Electric Rules help identify when this is happening.
There are four primary rules that are most widely used in practice. Each one targets a different type of abnormal pattern.
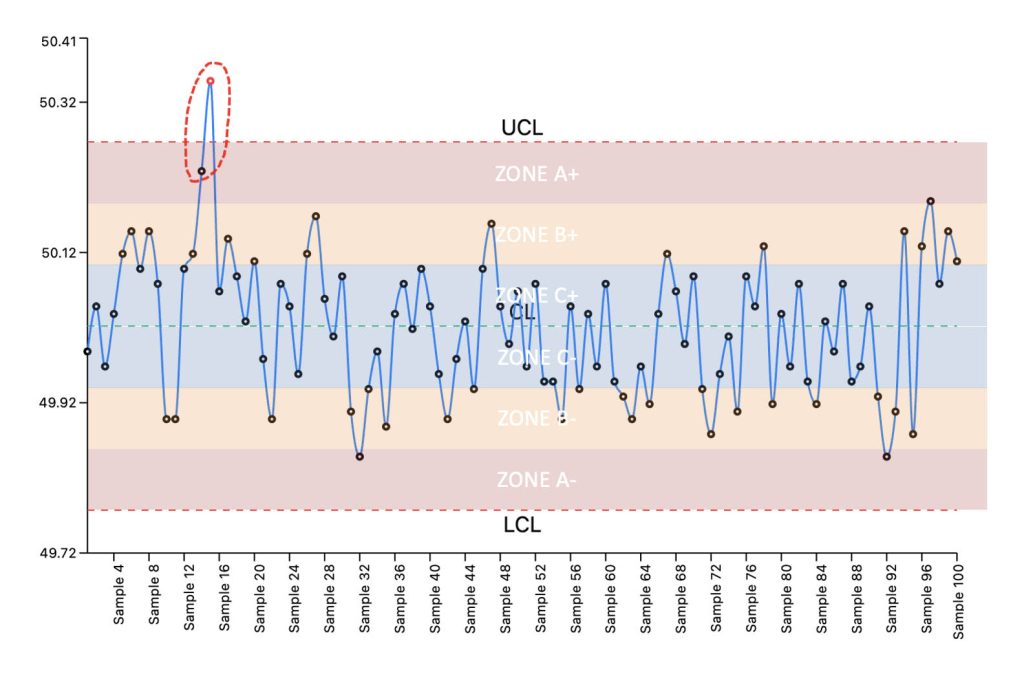
Rule 1 — One Point Beyond Three Sigma
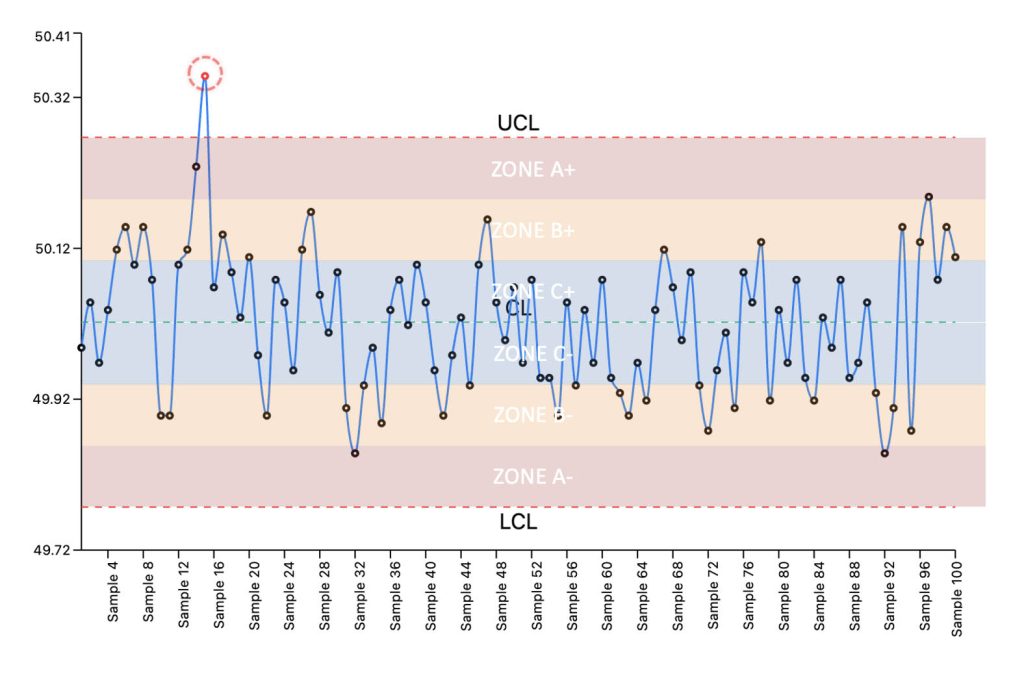
A single point falls outside the three-sigma control limit.
This is the strongest and most direct signal of special cause variation. Any single point that falls outside the Upper or Lower Control Limit — beyond ±3 sigma — is a Rule 1 violation. Because a value this far from the centre is statistically extremely unlikely in a stable process, it should trigger an immediate investigation.
If a data point falls outside the control limits, something unusual may be happening in the process.
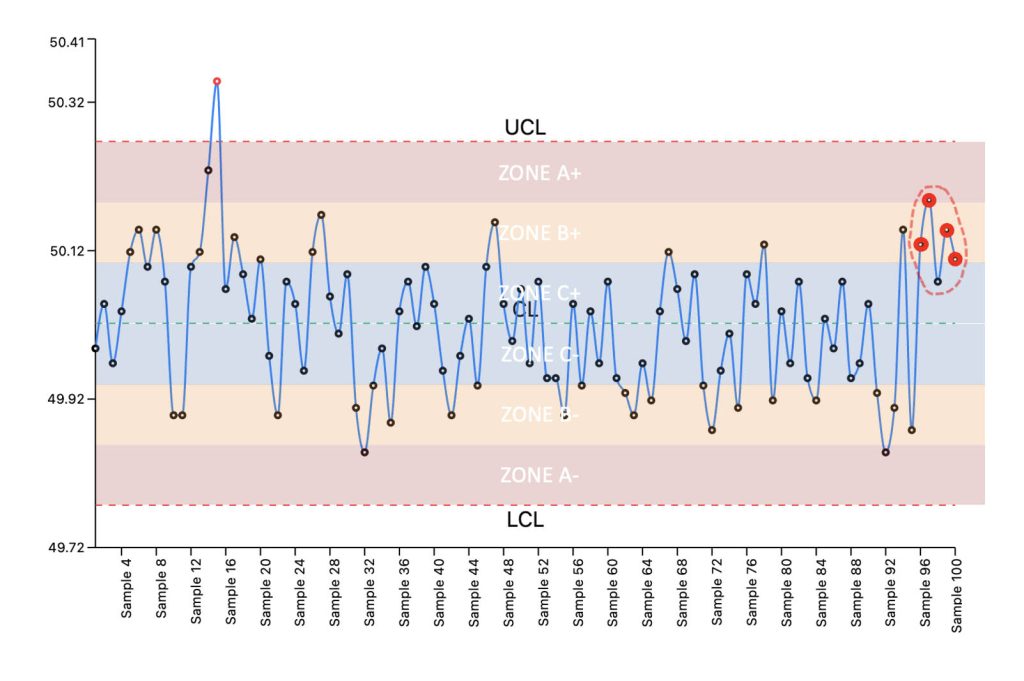
Rule 2 — Two Out of Three Points Beyond Two Sigma
Two out of three consecutive points fall beyond two sigma on the same side of the centre line.
An important detail here is the word beyond. This does not mean only the points sitting exactly in Zone A. It includes any point beyond the control limit — as long as they are on the same side of the centre line. Rule 2 is designed to detect a moderate shift in the process average. The process may also not have crossed a control limit yet, but something is clearly starting to move.
It is also worth noting that the same data point can be part of multiple rule violations simultaneously.
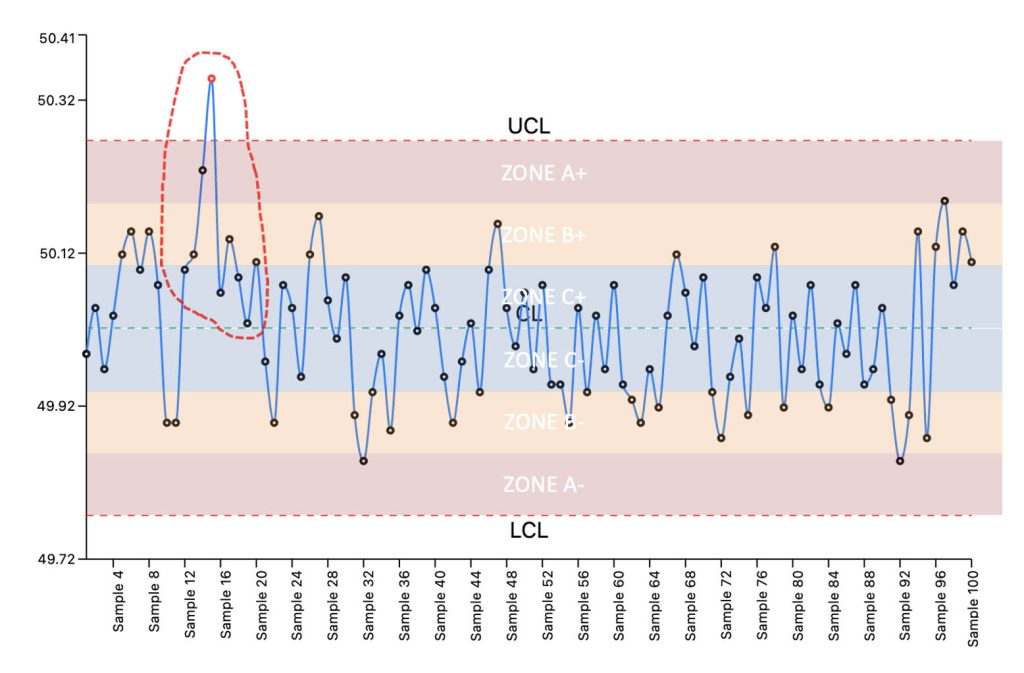
Rule 3 — Four Out of Five Points Beyond One Sigma
Four out of five consecutive points fall beyond one sigma on the same side of the centre line.
Rule 3 targets a smaller but more sustained process shift. The individual points may still appear well within the control limits and look perfectly safe at first glance. However, their consistent positioning on one side of the centre line suggests that the process average is gradually drifting away from the target. This kind of slow shift is easy to miss without the structure of the Western Electric Rules.
Rule 4 — Eight Consecutive Points on One Side
Eight consecutive points fall on the same side of the centre line.
In a stable process, data points should naturally fluctuate around the centre line. Seeing eight or more consecutive points consistently on the same side — above or below — is highly suspicious and suggests that the process average has shifted.
In the example (picture), nine consecutive points on one side of the centre line. Technically, Rule 4 is violated twice within that region. However, in practice this is usually described simply as those nine consecutive points triggering Rule 4 — the same practical interpretation applies to other rules as well. For example, if three consecutive points fall beyond the two-sigma zone on the same side, Rule 2 is technically violated twice, but it is typically described as those three points triggering the rule 2.
Additional Rules
The four rules described above are the most commonly applied in practice. However, there are additional Western Electric Rules that can help identify other abnormal process patterns — such as consistent trends in one direction, cyclical behaviour, or excessive overall variation. These extended rules provide even deeper insight into how a process is behaving over time.
Rule 5
Six consecutive points steadily increase or steadily decrease.
A continuous process drift or trend exists.
Rule 6
Fourteen consecutive points alternate up and down.
The process is oscillating or being over-adjusted.
Rule 7
Fifteen consecutive points fall within 1σ of the center line.
The variation is unusually small or artificially reduced.
Rule 8
Eight consecutive points fall outside 1σ from the center line (on either side).
The process variation has increased or mixed populations may exist.
Summary
The Western Electric Rules turn a control chart into a much more sensitive early warning system. Rather than waiting for a point to cross a control limit, they allow you to detect subtle shifts, drifts, and patterns long before the process becomes a serious problem. Here is a quick overview of the four primary rules:
| Rule | Condition | What It Detects |
|---|---|---|
| Rule 1 | 1 point beyond ±3σ | Strong signal — immediate special cause |
| Rule 2 | 2 of 3 consecutive points beyond ±2σ (same side) | Moderate process shift |
| Rule 3 | 4 of 5 consecutive points beyond ±1σ (same side) | Small but sustained process shift |
| Rule 4 | 8 consecutive points on one side of centre line | Process average has shifted |
| Rule 5 | 6 consecutive points steadily increasing or decreasing | Trend — process is drifting in one direction |
| Rule 6 | 14 consecutive points alternating up and down | Systematic pattern — cyclic or alternating behaviour |
| Rule 7 | 15 consecutive points within ±1σ (either side) | Stratification — unusually low variation |
| Rule 8 | 8 consecutive points beyond ±1σ (either side), none in Zone 1 | Mixture — data coming from two different distributions |
With SIGMADESK, you don’t need to manually scan your charts for rule violations. The platform automatically highlights all Western Electric Rule violations, identifies which data points are involved, and presents them in a clear, structured summary — so you can focus on investigating the process rather than searching through the data.
Leave a Reply