Process capability and process performance indices are among the most widely used metrics in Six Sigma and SPC — and among the most commonly misunderstood, even by experienced engineers. Cp, Cpk, Pp, and Ppk all compare process variation against customer specifications, but they answer fundamentally different questions.
This article breaks down exactly what sets them apart.
The Core Distinction
Both metric pairs evaluate how well a process fits within its specification limits, but they differ in which variation they measure:
- Cp and Cpk measure process capability using within-subgroup variation (short-term variation).
- Pp and Ppk measure process performance using overall variation (long-term variation).
Put simply:
Cp and Cpk ask: What is this process capable of when operating under stable conditions?
Pp and Ppk ask: How is this process actually performing over time?
Formulas Look Almost Identical
When you compare the formulas side by side, Cp/Cpk and Pp/Ppk are nearly the same — and that’s intentional. The only meaningful difference is how standard deviation (σ) is estimated:
- Cp and Cpk use σ within — estimated from within-subgroup variation.
- Pp and Ppk use σ overall — calculated from all measurements combined.
Everything else in the formula is identical. This single difference in sigma calculation is what drives all the practical differences between the two metric pairs.
Process Capability Formulas (Cp & Cpk)
Where σ overall is the standard sample standard deviation calculated from all measurements:
or
Process Performance Formulas (Pp & Ppk)
The numerators and structure are identical across all four formulas. The only difference is the denominator: σ within for capability, σ overall for performance.
How Cp and Cpk Are Calculated
Subgroup Collection
A Cp/Cpk study requires measurements collected in rational subgroups. A common industry approach — aligned with AIAG recommendations — is to collect 25 subgroups of 5 samples each, for a total of 125 measurements. Subgroups are typically defined by time, shift, batch, or another meaningful grouping factor.
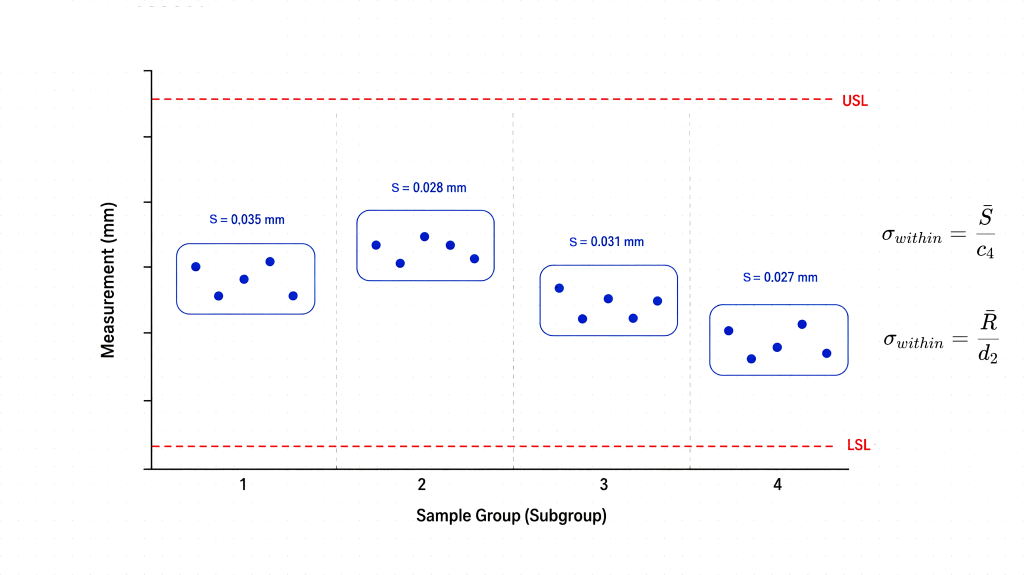
Sigma Within
When calculating σ within, between-subgroup variation is intentionally excluded. The standard deviation is estimated using only the variation observed within each subgroup — typically via the R-bar/d₂ method (average range divided by the appropriate control chart constant).
The sources of variation being filtered out include:
- Shift-to-shift differences
- Operator-to-operator variation
- Raw material lot changes
- Machine setup adjustments
- Environmental fluctuations
By removing these long-term sources, Cp and Cpk reveal the best-case potential of the process — what it can achieve when running consistently under a single stable set of conditions.
This is why even if a process drifts significantly between subgroups, Cp and Cpk can remain high as long as the within-subgroup variation stays tight.
How Pp and Ppk Are Calculated
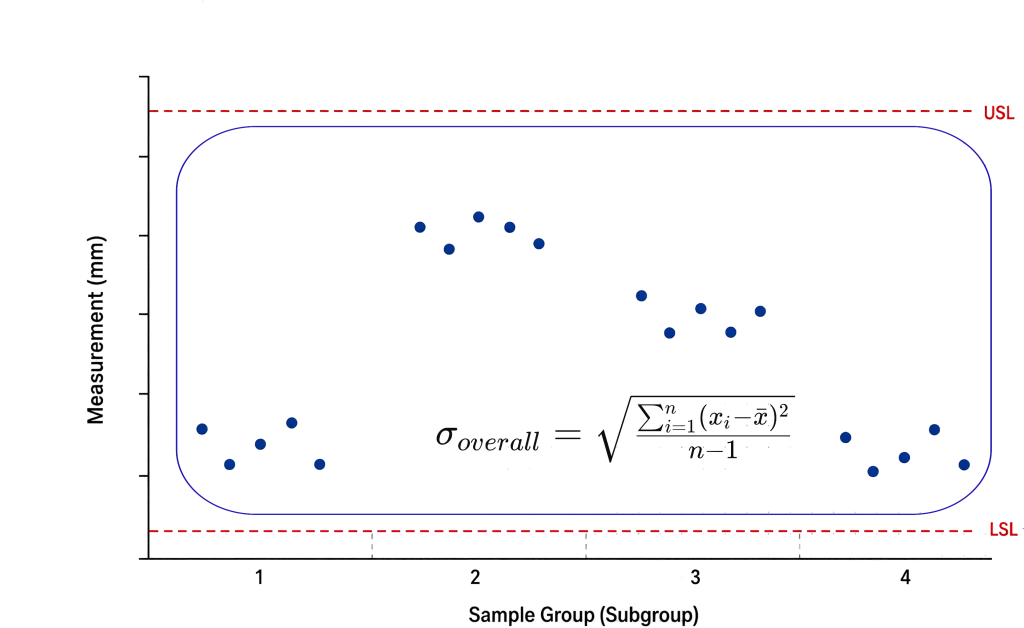
For Pp and Ppk, there are no subgroups to consider. The standard deviation is calculated directly from all measurements combined, using the standard sample standard deviation formula.
Because no variation is filtered out, σ overall captures every real-world source of process variation: different operators, different shifts, raw material lot-to-lot differences, machine wear, seasonal changes, and anything else that influences the process over the full study period.
As a result, Pp and Ppk represent actual process performance as a customer or downstream process would experience it.
Interpreting the Relationship Between the Two Pairs
In practice, Pp and Ppk are almost always lower than Cp and Cpk. This is expected — σ overall is typically larger than σ within, so the performance indices are more conservative.
The gap between the two pairs is itself informative:
- A large gap suggests significant long-term variation sources (e.g., lot-to-lot material shifts, significant operator differences) that are not visible in within-subgroup analysis.
- A small gap indicates that within-subgroup and overall variation are similar — the process is stable across subgroups with no dominant long-term effects.
Summary
| Cp & Cpk | Pp & Ppk | |
|---|---|---|
| Variation measured | Within-subgroup (short-term) | Overall (long-term) |
| Sigma method | R-bar / d₂ (σ within) | Sample std dev (σ overall) |
| Subgroups required | Yes | No |
| Question answered | What can the process achieve under stable conditions? | How is the process actually performing over time? |
Process Capability (Cp/Cpk) tells you the potential. Process Performance (Pp/Ppk) tells you the reality. Used together, they give you a complete picture of where your process stands and where improvement effort should focus.