SIGMADESK – Online Control Chart Generator
Built for Real SPC Work
SIGMADESK is an online SPC software platform that lets you build, analyze, and interpret control charts directly in your browser. It covers the full range of chart types that quality practitioners actually use in the field.
Variable control charts for continuous measurement data:
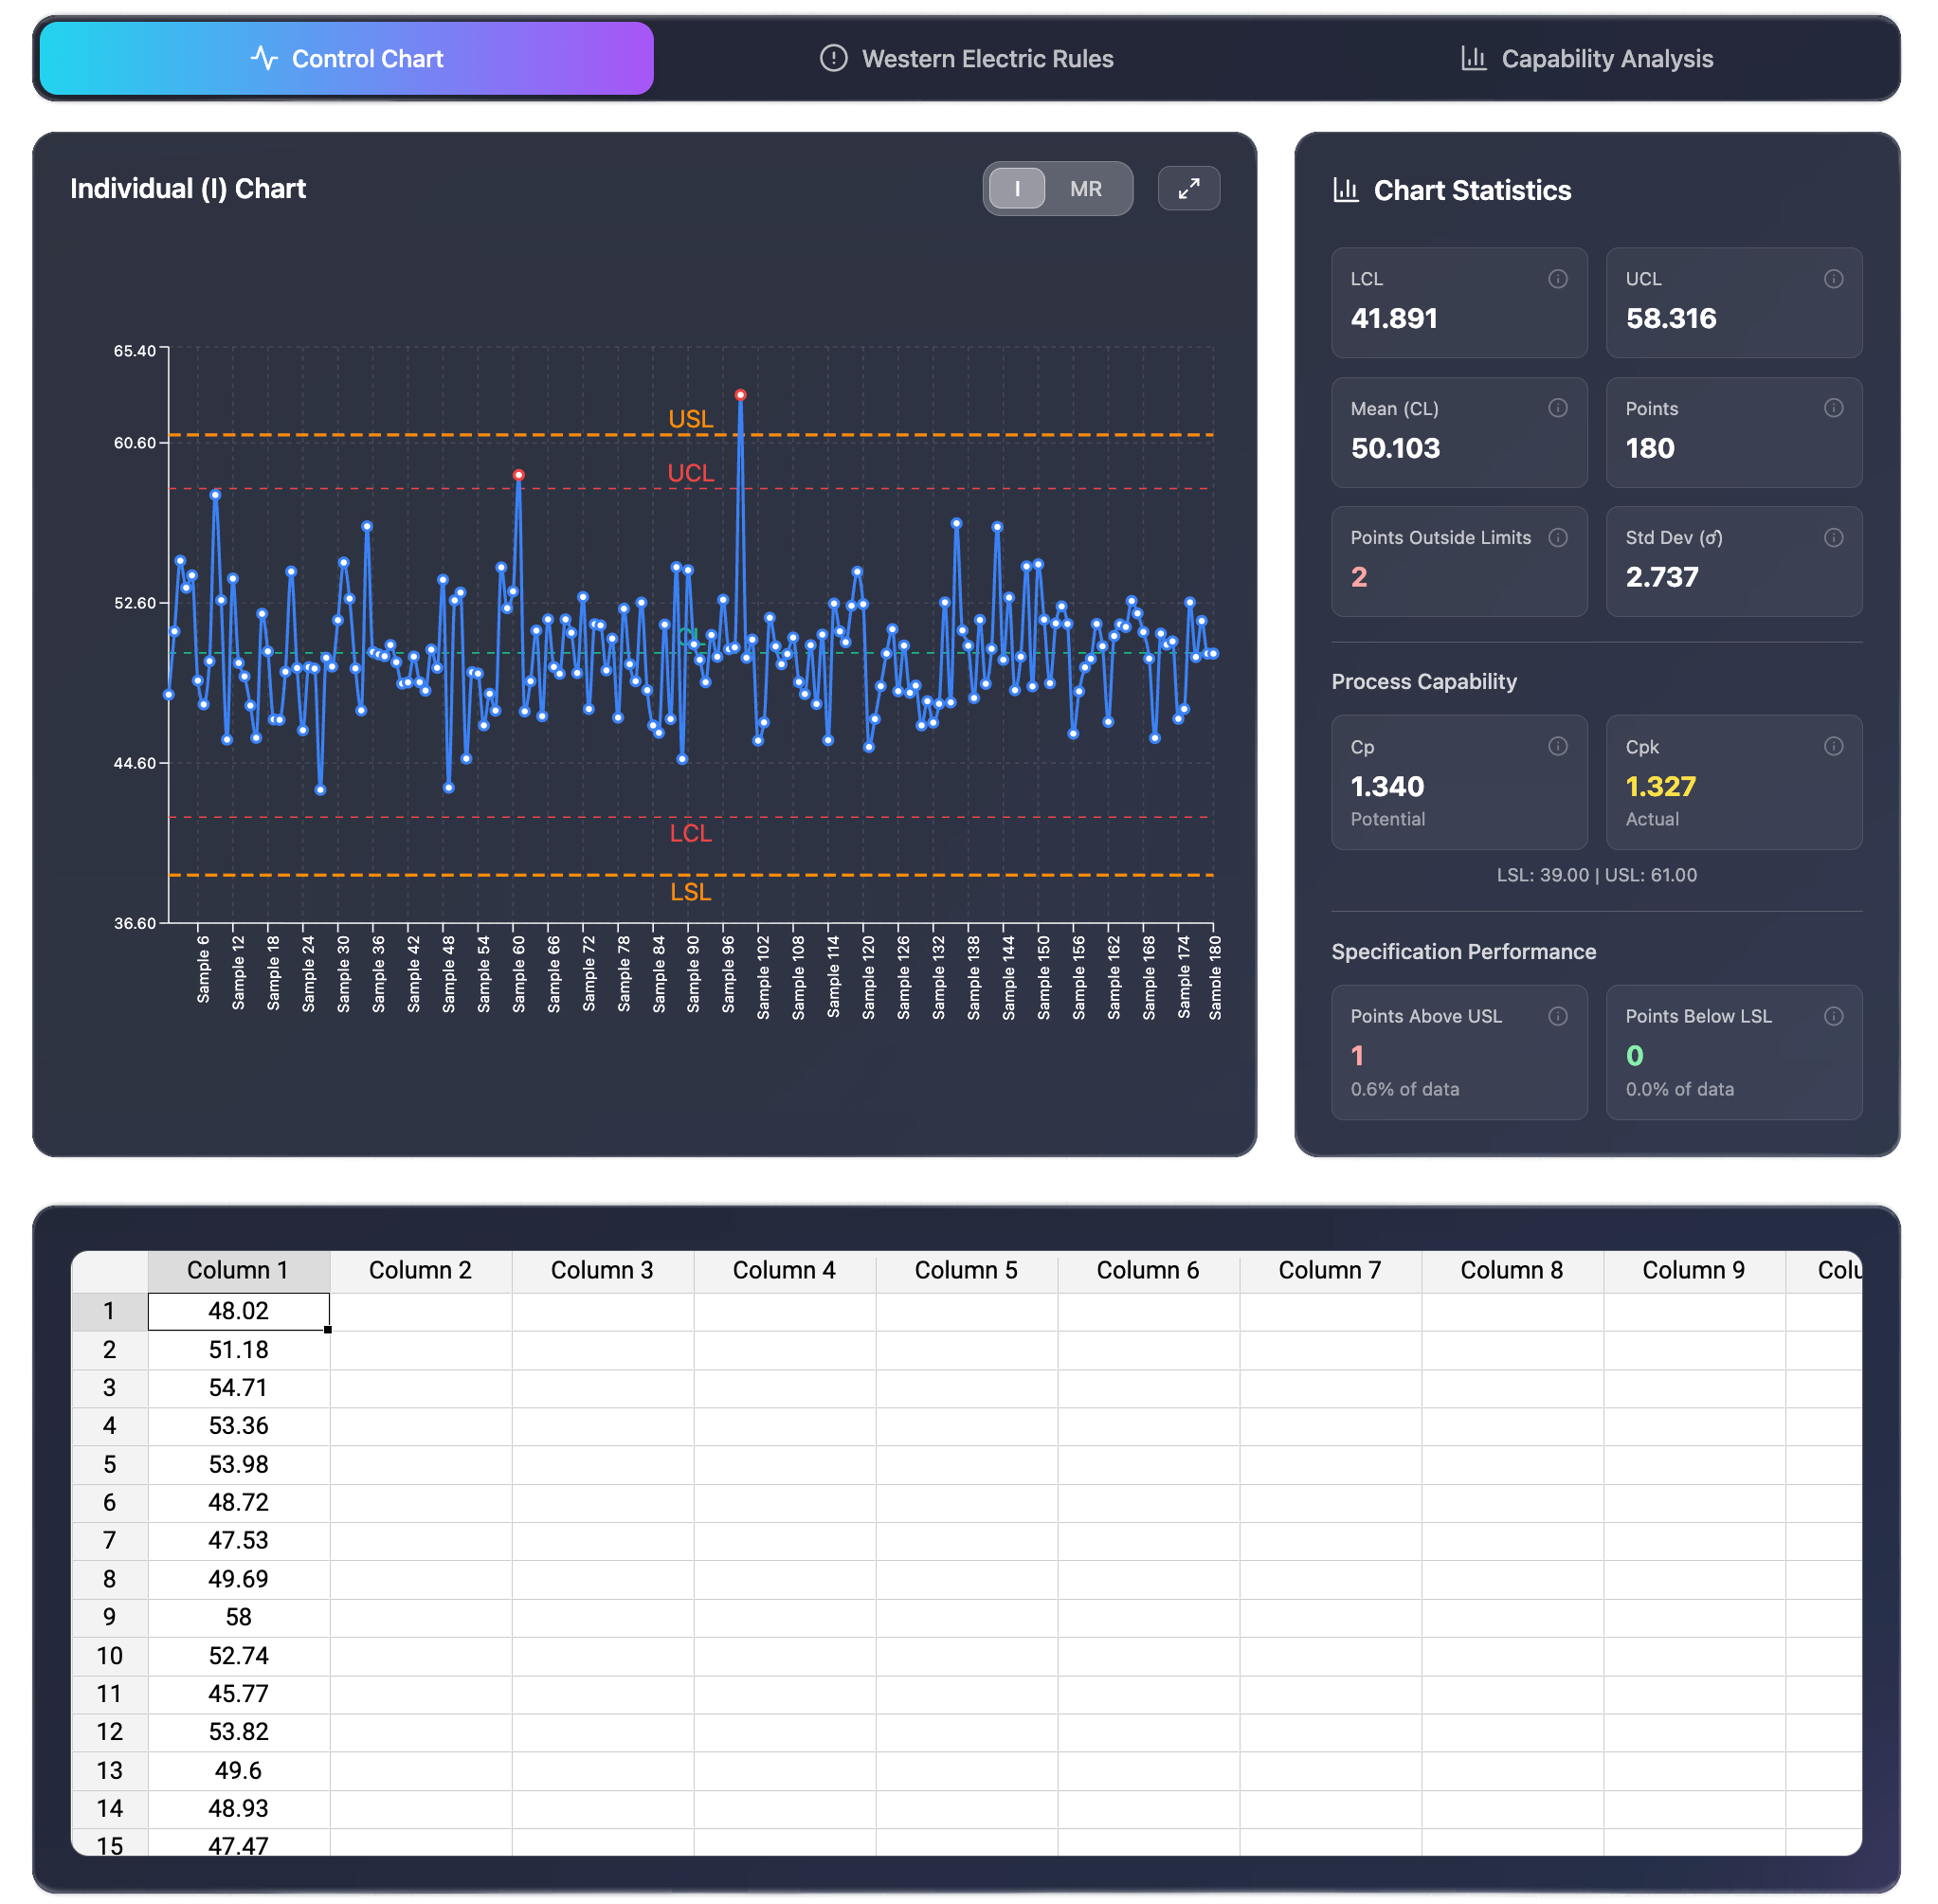
- I-MR chart (Individuals and Moving Range) — the right choice for processes where you measure one unit at a time, or where subgrouping is not practical.
- Xbar-R chart (Mean and Range) — the workhorse of SPC in manufacturing, used when you collect small subgroups and want to track both the process mean and within-subgroup variation.
- Xbar-S chart (Mean and Standard Deviation) — preferred over Xbar-R for larger subgroup sizes, where the sample standard deviation gives a more efficient estimate of spread.
Individual Chart — every measurement plotted separately
Attribute control charts for count-based data:
- p chart — monitors the proportion of nonconforming units in a sample, ideal when your subgroup size varies from inspection to inspection.
- np chart — tracks the number of nonconforming units when sample size is constant.
- c chart — counts defects per unit on a fixed inspection area or time window.
- u chart — tracks defects per unit when the inspection area or opportunity varies.
P-Chart — proportion defective with variable subgroup sizes
Each chart type follows the correct statistical formulas, applies the right control limit calculations, and displays both the main chart and the range or standard deviation sub-chart where applicable.
A control chart is only as useful as the analysis behind it. SIGMADESK is built with that in mind.
Western Electric Rules are built in. You can toggle rule detection on or off and see exactly which data points trigger which patterns — Zone A violations, runs above or below the centerline, trends, and more. These are the same rules taught in every Lean Six Sigma certification and used in serious manufacturing environments.
Stages let you define breakpoints in your data — before and after a process change, across different production shifts, or spanning a kaizen event. Control limits recalculate independently for each stage, which is exactly how SPC should handle process changes. This is a feature typically found only in paid software.
Process capability analysis is integrated directly. Once your process is confirmed stable through control chart analysis, you can move to Cp, Cpk, Pp, and Ppk calculations in the same workflow — no switching tools, no re-entering data, just enter your specification limits.
Flexible data entry means you are not locked into a rigid format. Whether you are working with individual measurements, subgroups of varying sizes, or attribute inspection counts, the data grid adapts to your chart type.
And you'll discover many more features of SIGMADESK throughout your SPC journey.
More on Statistical Process Control
-
Cp and Cpk: What’s the Difference? Explained
Process capability indices, Cp and Cpk, are two of the most commonly reported numbers in quality engineering. They’re calculated from the same underlying measurement data but they answer two different questions, and confusing them can lead to the wrong conclusion about whether a process is actually capable. This article focuses specifically on the distinction between Cp and Cpk, so if you need a fuller introduction and more comprehensive look to the process capability, that’s better you start with complete guide on Process Capability. Here, the goal is to make the difference between these two indices unambiguous. What Cp Measures Cp…
-
Population vs. Sample Standard Deviation: What’s the Difference?
A practical guide to standard deviation — what it measures, why it matters, and the difference between population and sample standard deviation explained with clear examples. Standard deviation is one of the most important concepts in statistics. It appears in manufacturing quality control, finance, healthcare, scientific research, and virtually any field where data needs to be understood. Yet despite its widespread use, the concept is often explained in ways that feel abstract or overly mathematical. This guide breaks it down step by step — what standard deviation actually measures, how to calculate it, and why there are two different versions…
-
SPC Control Charts for Variables (I-MR, Xbar-R, Xbar-S) Explained
A practical guide to control charts — from common vs. special cause variation to I-MR, X̄-R and X̄-S charts, control limit formulas, and when to use each one. Control charts are one of the core tools used in Six Sigma, quality management, and process improvement methodologies. They are especially common in engineering and manufacturing, but their usefulness is not limited to these fields. In fact, control charts can be applied anywhere data is collected over time. For example, you might use a control chart when you are: Although these examples come from different areas, they all have one important thing in…