
This article walks through the most widely used MSA method, the Gage R&R study (Gage Repeatability and Reproducibility): what it measures, how to plan it, how to execute it on the shop floor, and how to interpret the results against industry acceptance criteria.
Before you trust any measurement, you need to answer one question:
Is the variation you see coming from your process, or from your measurement system itself?
If the gage is unreliable, every control chart, every capability study, and every process decision built on that data is untrustworthy. This is why Measurement System Analysis (MSA) belongs at the start of any quality improvement project — not the end.
What a Gage R&R Study Measures
Every process produces variation, and when you measure a set of parts you observe a spread in the results. The key insight is that this observed spread is not pure part variation. It is the combination of the true variation between the parts and the variation added by the act of measuring them:
σ²total = σ²part + σ²measurement
If you want to see your natural process variation, the measurement system’s contribution must be small relative to the real process variation. Otherwise, measurement noise hides what the process is actually doing.
Measurement system variation itself has two components, and separating them is the entire purpose of the study:
σ²measurement = σ²repeatability + σ²reproducibility
- Repeatability (equipment variation, EV) — the variation of the instrument or method itself: the spread you observe when the same operator measures the same part multiple times with the same instrument. If one person gets noticeably different readings on one part, the gage has a repeatability problem.
- Reproducibility (appraiser variation, AV) — the variation between operators measuring the same parts with the same instrument. If operator A consistently reads differently than operator B, that difference usually points to technique, training, or an ambiguous measurement method.
Together, repeatability and reproducibility form the total measurement system variation, which is then evaluated two ways:
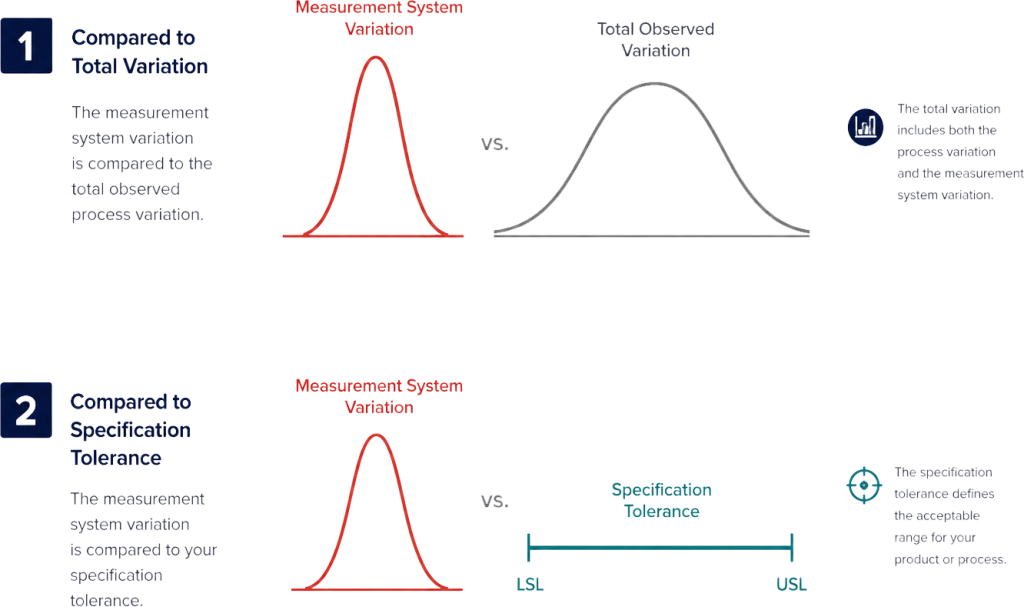
| Metric | Compares measurement variation against | Use when the gage is used for |
|---|---|---|
| % Study Variation | Total observed variation (parts + measurement) | Process control and improvement |
| % Tolerance | The specification width (USL − LSL) | Inspection against customer or design specs |
Putting it all together:
A Gage R&R study is a structured experiment in which several operators measure the same set of parts multiple times, so the total variation can be decomposed into repeatability, reproducibility, and part-to-part variation — and the acceptability of the measurement system can be judged with numbers rather than opinions.
Planning the Study
The quality of your planning determines whether the study can be trusted at all. The standard crossed Gage R&R design uses:
| Parameter | Standard value | Notes |
|---|---|---|
| Parts | 10 | Must span the full range of real process variation |
| Operators | 3 | The people who actually perform this measurement in production |
| Trials (replicates) | 3 | Each operator measures each part this many times |
| Total measurements | 90 | 10 × 3 × 3 |
These numbers can be adjusted, but this combination is the industry default because it balances statistical power against practical effort.
Three planning rules matter more than anything else:
- Select parts across the full process spread. Do not grab ten parts from the same box produced in the same hour. Pull parts from different hours, batches, shifts, or mold cavities — including parts near both specification limits if possible. If the parts are too similar, part-to-part variation will look tiny and the study will unfairly blame the gage.
- Use the real operators. Choose the people who actually perform this measurement in daily production. Using your best metrology specialist when the routine measurements are done by line operators produces a study that describes a system that does not exist.
- Use the real gage, calibrated. Run the study with the same instrument used in production, and verify its calibration status before starting.
Executing the Study
The walkthrough below uses MSA module on SIGMADESK.
1. Define the study
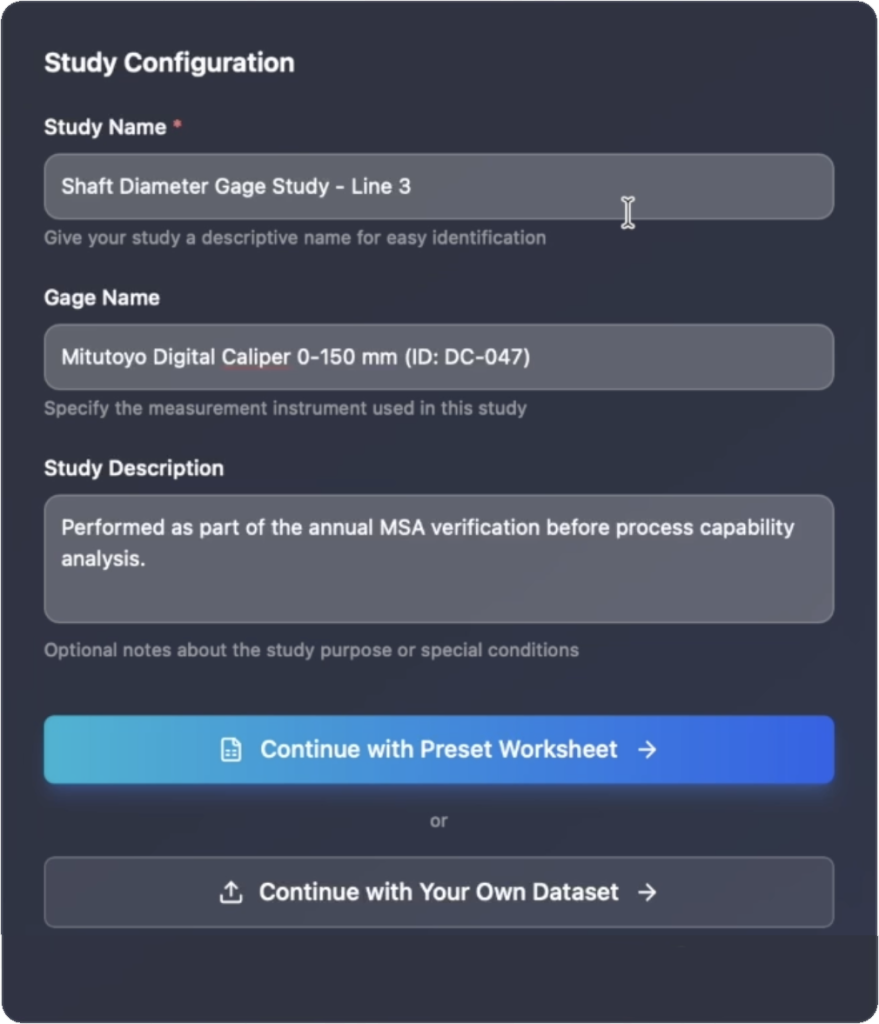
From the dashboard, open the MSA module and create a new study. Enter a descriptive study name (e.g., “Shaft Diameter Gage Study — Line 3”), the exact gage name with its identification number, and any relevant notes. Do not skip these fields: six months from now, or when an auditor asks, this header is what documents what was measured, with which gage, and why.
2. Generate the worksheet
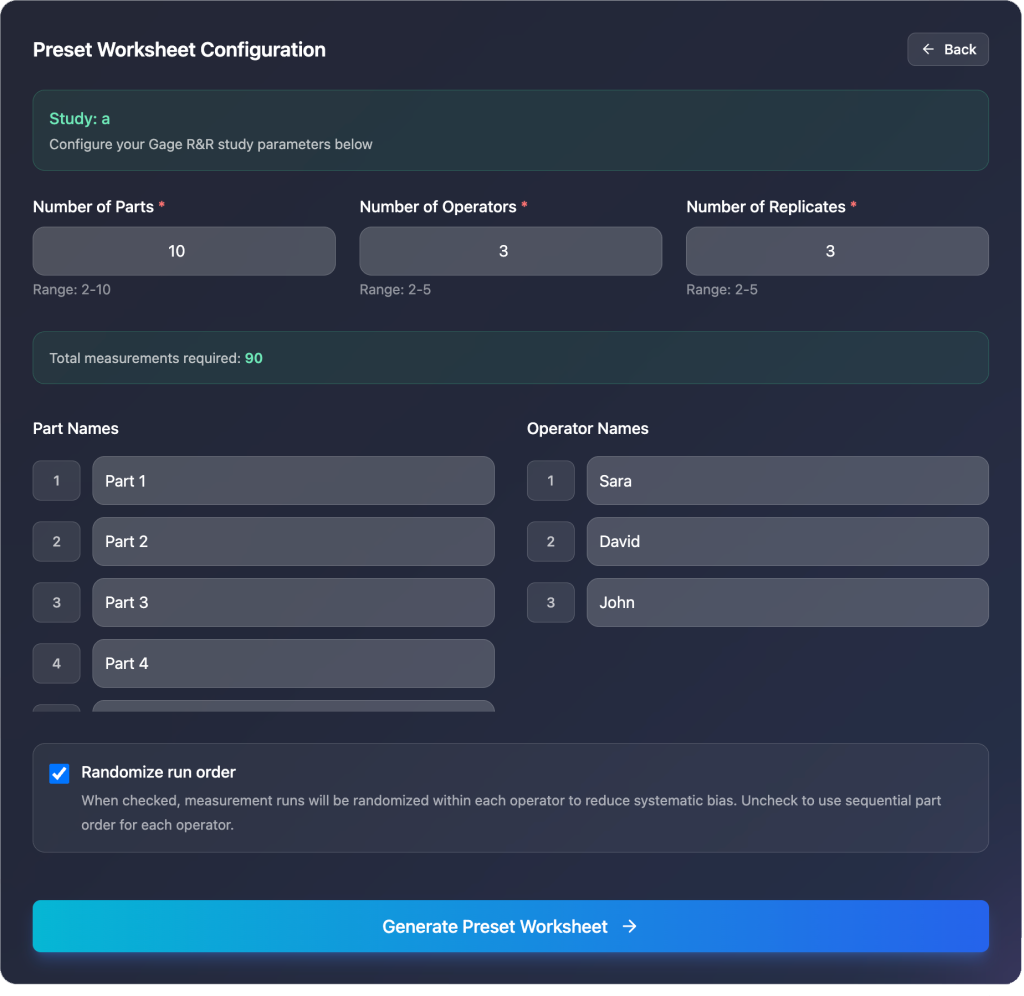
If you have already collected measurements elsewhere, you can paste in your own dataset. Starting from zero, the recommended path is a preset worksheet: enter 10 parts, 3 operators, and 3 replicates, and the application builds the entire study structure. Rename operators to their real names or initials — it makes the results far easier to discuss with the team afterwards.
One configuration detail deserves special attention: randomized run order. When enabled (the default), the measurement sequence is shuffled within each operator, so nobody measures part 1, part 2, part 3 in a predictable line. This matters because if an operator remembers that part 5 read 12.03 on the first trial, they will unconsciously steer toward the same reading on the second trial. The gage will look more consistent than it really is, and the results will be too optimistic. Randomizing the order — and keeping part identities hidden from the operator — protects the study from this bias.
3. Record the measurements
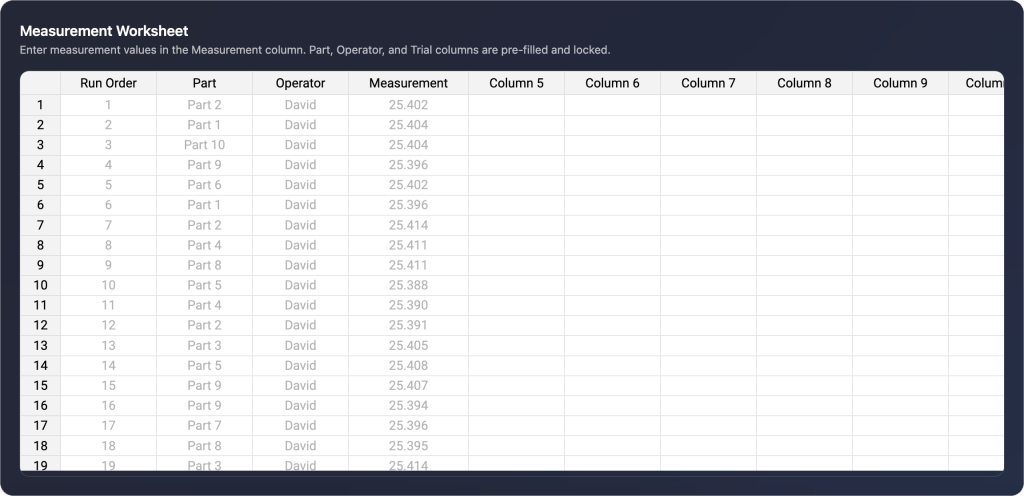
The generated worksheet contains one row per measurement — 90 rows in total, each with a run order number, a part, an operator, and an empty measurement cell. The design columns are locked; the only thing you type is the measured value.
Follow the worksheet from top to bottom: hand the indicated part to the indicated operator, record the reading, move to the next row. Ideally, the person handling the parts and the worksheet is not the person measuring — the operator only measures and reads the value aloud, without seeing part labels or previous results.
Two rules while recording:
- Enter values exactly as the gage displays them, with all decimals. Do not round.
- No do-overs. If a reading looks strange, enter it anyway. That strange reading may be exactly the measurement system behavior you are trying to detect. You are testing the system as it normally operates, not staging an ideal showcase.
4. Map columns and enter tolerance limits
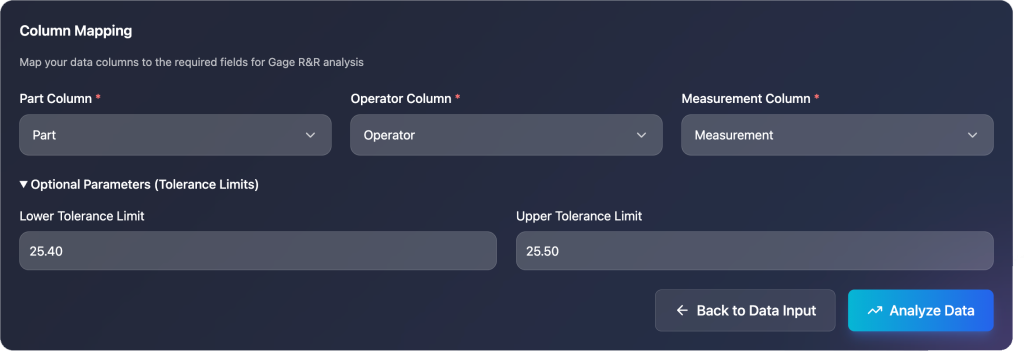
With a preset worksheet, the part, operator, and measurement columns are recognized automatically. One optional field is worth filling in: the lower and upper specification limits of the measured characteristic. This enables the % Tolerance calculation. Skipping it still produces the study variation results, but you lose the second acceptance criterion.
Two classical methods exist. The Average and Range method is simpler to compute by hand, but the ANOVA method is the modern standard because it can detect the operator-by-part interaction, which the range method cannot see. Every serious software tool uses ANOVA, and that is what the results below are based on.
Interpreting the Results
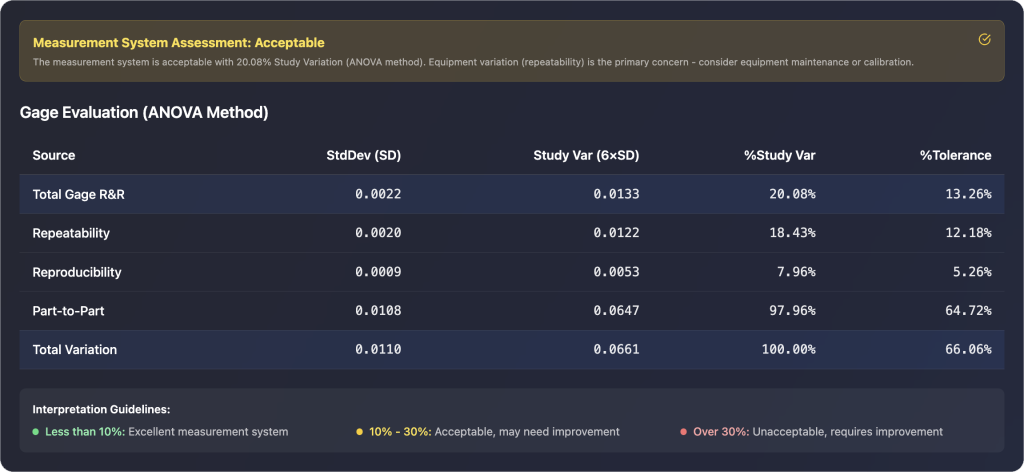
The core output is the Gage Evaluation table. The columns are:
- StdDev (σ) — the standard deviation attributed to each variation source.
- Study Variation (6σ) — six times the standard deviation. Because ±3σ covers approximately 99.7% of a normal distribution, 6σ is the conventional window representing the full spread of each source.
- % Study Variation — each source’s 6σ as a percentage of total study variation.
- % Tolerance — each source’s 6σ as a percentage of the specification width.
Here are the results from the shaft diameter study:
| Source | % Study Variation | Interpretation |
|---|---|---|
| Total Gage R&R | 20.08% | Variation belonging to the measurement system |
| — Repeatability | 18.43% | Equipment/method variation |
| — Reproducibility | 7.96% | Operator-to-operator variation |
| Part-to-Part | 97.96% | Real differences between products |
| Total Variation | 100.00% | By definition |
Two observations from this table:
Repeatability dominates the measurement error. At 18.43%, it is more than twice reproducibility (7.96%). The three operators agree with each other quite well; the instrument itself is the weaker link. This single comparison tells you where to look first if the system needs improvement.
Part-to-part variation is 97.96% — exactly what you want. In a healthy measurement situation, most observed variation should come from the parts, not from the act of measuring them. The gage is spending its effort seeing real product differences, not its own noise.
Why the percentages exceed 100%
A common point of confusion: 20.08% + 97.96% is clearly more than 100%. Is the table wrong? No — standard deviations do not add; variances do. The columns are consistent in squares:
20.08² + 97.96² ≈ 403 + 9,596 ≈ 10,000 = 100²
Alongside the Gage Evaluation table, a full ANOVA report also provides the variance components table, the raw sums of squares, and six diagnostic charts if you want to verify the mathematics. But for the acceptance decision, the Gage Evaluation table is where the answer lives.
Acceptance Criteria
The decision rules below follow the AIAG MSA guidelines used across most industries:
| % Gage R&R | Verdict | Action |
|---|---|---|
| Under 10% | Acceptable | The measurement system can be trusted |
| 10%–30% | Conditionally acceptable | May be tolerated depending on the importance of the application, the cost of the gage, and the cost of improvement — document the justification |
| Over 30% | Unacceptable | The measurement system must be improved before relying on its data |
Decide up front which benchmark drives the decision. If the gage is used for process control and improvement, judge against % Study Variation. If it is used primarily for inspection against specifications, % Tolerance is the more relevant criterion.
By these rules, the example study — 20.08% Gage R&R with repeatability as the dominant component — is conditionally acceptable, with a clear improvement target: the equipment, not the operators.
What to Do When a Study Fails
The diagnosis depends on which component dominates:
- If repeatability dominates, the problem is the equipment or the method. Investigate gage resolution, wear, fixturing, part clamping, and environmental factors such as vibration or temperature. Sometimes the fix is as simple as a better fixture that locates the part the same way every time.
- If reproducibility dominates, the problem is between operators, which almost always means the measurement procedure is ambiguous. Standardize the method: define exactly where on the part to measure, how much force to apply, and how to read the scale. Retrain everyone to that single standard, then repeat the study.
Summary of MSA Study
A trustworthy measurement system is the foundation of everything else you do in quality. A crossed Gage R&R study — ten parts spanning the real process spread, three production operators, three randomized trials — decomposes your observed variation into repeatability, reproducibility, and part-to-part components, and gives you an objective, numbers-based verdict on whether your gage can be trusted.
If you want to run your own Gage R&R analysis without expensive software, try MSA calculator on SigmaDesk. It is entirely web-based, and you can go from raw data to a full ANOVA report in minutes.
Frequently Asked Questions
What is the difference between repeatability and reproducibility?
Repeatability is the variation observed when the same operator measures the same part multiple times with the same instrument — it reflects the equipment or method. Reproducibility is the variation between different operators measuring the same parts — it reflects differences in technique or training.
How many parts, operators, and trials do I need for a Gage R&R study?
The industry standard is 10 parts, 3 operators, and 3 trials, giving 90 measurements. These numbers can be adjusted, but this combination balances statistical power with practical effort.
Should I use the ANOVA method or the average and range method?
Use ANOVA. It is the modern standard because it can detect the operator-by-part interaction, which the average and range method completely misses.
What is an acceptable Gage R&R percentage?
Under the AIAG guidelines, below 10% is acceptable, 10–30% is conditionally acceptable depending on the application and cost of improvement, and above 30% is unacceptable.