How to Create an Xbar-R Control Chart Online | SPC Guide
A practical walkthrough of creating and interpreting an Xbar-R (Xbar-Range) Control Chart using SIGMADESK — covering subgrouping theory, the Xbar Chart, the R Chart, and how they work together to reveal process stability.
In this guide, we'll walk through how to create and interpret an Xbar-R Control Chart — also known as an Xbar-Range Chart — using SIGMADESK. If you're new to subgroup-based control charts, this practical example will help you understand both the theory and real-world application step by step.
If you haven't yet worked with control charts at all, we recommend starting with our introductory article SPC Control Charts (I-MR, Xbar-R, Xbar-S) Explained — Complete Guide, which covers the fundamentals of common and special cause variation and how control charts are structured.
What Is an Xbar-R Control Chart?
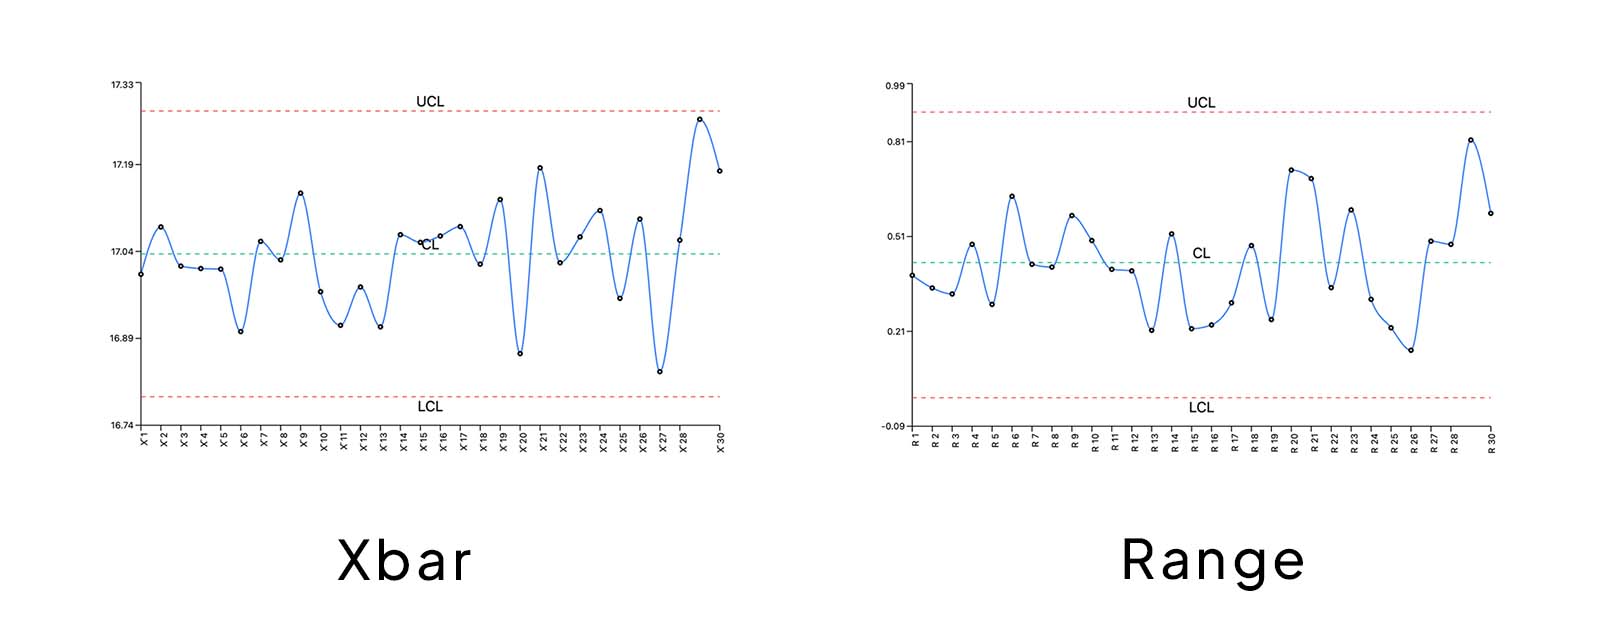
An Xbar-R Chart actually consists of two charts used together:
- Xbar Chart: Monitors variation between subgroup averages
- R Chart: Monitors variation within each subgroup
This chart type is commonly used when measurements are collected in small subgroups — such as multiple samples from the same production batch or logical measurement groups collected from each batch. Xbar-R Charts are among the most widely used quality control charts in Statistical Process Control (SPC).
Step 1: Open the Control Chart Generator and Load a Dataset
To begin, visit SIGMADESK and select the Control Chart Generator from the homepage. This opens the control chart interface directly.
In a previous guide we covered the I-MR Chart, which is the default chart type when you first open the generator. For this example, simply switch the chart type to Xbar-R Chart.
From there, you can either:
- Paste your dataset directly into the spreadsheet
- Or load a previously saved chart
For this example, we'll load a chart that was saved earlier using the Chart Options section. Once loaded, SIGMADESK automatically visualizes the Xbar-R Chart.
Understanding the Xbar-R Charts
Before interpreting the chart, it's important to understand how subgrouping works — because this is what makes the Xbar-R Chart fundamentally different from the I-MR Chart.
What Is a Subgroup?
Imagine you're performing quality control during a supplier incoming inspection process. For every supplier production batch, you inspect five parts and record their measurements.
Instead of plotting every individual measurement directly, the data is organized into subgroups — in this case, groups of five measurements, one subgroup per batch.

This subgroup structure is what separates the Xbar-R Chart from an I-MR Chart. With an I-MR Chart, every single measurement is plotted individually. With an Xbar-R Chart, the data is first summarized per subgroup before plotting. This has two important consequences:
- The Xbar Chart plots one point per subgroup — the average of that subgroup's measurements
- The R Chart plots one point per subgroup — the range (max minus min) of that subgroup's measurements

In our supplier inspection example, if you inspect 30 batches with 5 parts each, both charts will have exactly 30 plotted points — not 150.
The Xbar Chart Explained
Unlike an I-Chart, where every individual measurement is plotted directly, the Xbar Chart uses subgroup averages. For each subgroup, the average of the measurements is calculated and plotted sequentially on the chart.
Center Line (CL) of the Xbar Chart
The Center Line represents the average of all subgroup averages. It reflects the overall process average across all batches.
Upper and Lower Control Limits (UCL & LCL)
The control limits define the expected range of natural variation in subgroup averages. They are statistically calculated based on subgroup variation and sample size. The Xbar Chart primarily helps monitor variation between subgroups or batches.
The R Chart Explained
While the Xbar Chart monitors changes in subgroup averages, it does not show how much variation exists within each subgroup. That's where the R Chart becomes important.
Within each subgroup, the difference between the maximum value and the minimum value is calculated. This difference is called the Range. The R Chart plots these range values sequentially.
Key Components of the R Chart
The R Chart contains:
- A Center Line representing the average range
- Upper and Lower Control Limits
- Estimated process variation
The purpose of the R Chart is to monitor variation within each subgroup.
Why Use Xbar and R Charts Together?
Using Xbar and R Charts together is extremely powerful because they help monitor two different sources of variation.
Xbar Chart → Between-Subgroup Variation
This reflects variation between subgroups — in our example, variation between different supplier batches. Possible causes include:
- Machine setup changes
- Material differences between batches
- Supplier inconsistencies
- Shift-to-shift variation
R Chart → Within-Subgroup Variation
This reflects variation inside each subgroup or batch. Possible causes include:
- Short-term machine instability
- Measurement inconsistency
- Operator variation
By separating these two sources of variation, teams gain a much clearer understanding of overall process stability — making root cause analysis significantly more effective.
A process can look stable on the Xbar Chart while showing excessive within-subgroup variation on the R Chart, or vice versa. You need both views to get the full picture.
Step 2: Review the Xbar-R Chart in SIGMADESK
Inside SIGMADESK, the Xbar and R Charts display:
- Center Line
- Upper Control Limit
- Lower Control Limit
- Total number of subgroups
- Number of subgroup averages outside control limits
- Estimated process standard deviation
These are the primary components used to evaluate process behavior and identify statistical abnormalities.
Using Western Electric Rules for Your Xbar-R Chart
SIGMADESK also allows users to analyze Western Electric Rule violations. These rules help identify non-random process patterns such as:
- Trends
- Cycles
- Process shifts
- Consecutive runs above or below the center line
Western Electric Rules are one of the most useful tools for interpreting control chart behavior beyond simple control limit violations. They help detect early warning signs of instability even when all points remain within control limits.
Do You Need to Know How the Calculations Work?
While understanding the statistical theory behind Xbar-R Charts is valuable, modern SPC tools like SIGMADESK automatically perform all calculations for you — including:
- Control limits
- Sigma estimates
- Range averages
- Process variation metrics
However, if you're curious about the statistics underpinning control charts, our detailed article SPC Control Charts Explained — Complete Guide covers the theoretical foundations in depth.
Taking It Further: Process Capability
Once your Xbar-R Chart confirms that your process is in statistical control, a natural next step is to ask: is this process actually meeting customer requirements? That's the question answered by Process Capability Analysis (Cp, Cpk, Pp, Ppk). SIGMADESK lets you run both analyses on the same dataset, making it straightforward to move from stability assessment to capability evaluation.
Final Thoughts
Xbar-R Charts are among the most important tools used in manufacturing quality control and process improvement. By monitoring both:
- Variation between subgroups
- Variation within subgroups
they provide a comprehensive understanding of process stability that a single chart alone cannot deliver.
Whether you work in manufacturing, quality engineering, Lean Six Sigma, process engineering, or operations improvement, learning how to interpret Xbar-R Charts is a valuable skill that supports data-driven decision-making and continuous improvement.
If you'd like to practice, explore the SIGMADESK Control Chart Generator using your own datasets and instantly analyze process stability.
Ready to build your first control chart?
Try SIGMADESK for free