A practical guide to capability metrics — from specification limits and standard deviation to Cp, Cpk, Pp, Ppk, and the difference between short-term and long-term variation.
Process capability analysis is one of the most important concepts in quality engineering and manufacturing. Yet for many people, capability metrics like Cp, Cpk, Pp, and Ppk can feel confusing or overly statistical.
In reality, the core idea is very simple:
Every process has variation.
The real question is whether that variation is small enough to consistently meet customer requirements.
Capability metrics help us predict how a process is likely to behave in the future. This is why customers often require capability studies before approving a process, especially for critical characteristics.
In this article, we’ll break down:
- What process capability actually means
- The difference between Cp and Cpk
- The difference between Pp and Ppk
- Why customers care about these metrics
- How short-term and long-term variation affect capability studies
Understanding Specification Limits
Imagine we manufacture a rubber duck with a target diameter of 100.15 mm. The customer defines these requirements:
- Anything below 100.10 mm is unacceptable
- Anything above 100.20 mm is also unacceptable
These boundaries are called:
- LSL — Lower Specification Limit
- USL — Upper Specification Limit
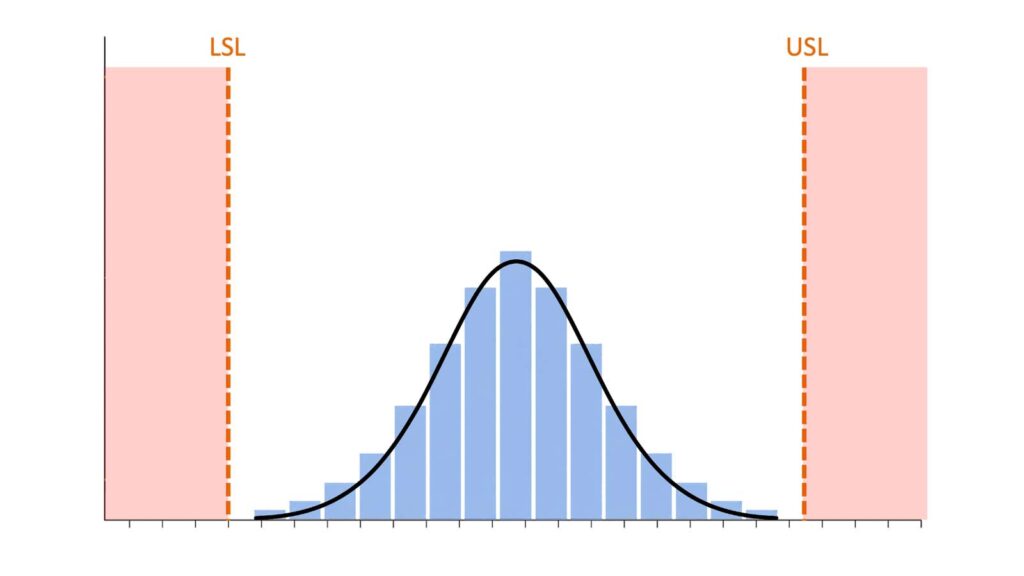
Now imagine collecting measurements from the process and plotting them on a distribution chart. Most measurements cluster around the average, while fewer appear near the extremes, creating the familiar bell-shaped curve.
The key question becomes:
Does the process distribution fit comfortably inside the specification limits?
- If yes, the process is considered capable.
- If no, defects will eventually occur — even if they have not appeared yet.
This is the entire foundation of process capability analysis.
How Many Measurements Are Needed?
Before performing a capability study, we need enough data. Unless the customer specifies otherwise:
- 30 measurements is generally considered the minimum for meaningful statistical analysis.
- 100 measurements or more is strongly recommended for more reliable results.
In practice, capability analysis should ideally be continuous rather than based on a one-time sample size. Manufacturing processes evolve constantly, and a capability study performed during project launch may no longer represent reality several months later.
Of course, continuous monitoring also adds cost. Companies must balance:
- the cost of monitoring the process,
- versus the cost of defects and customer complaints later.
Measurement System Analysis Comes First
Before performing any capability study, the measurement system itself must already be validated. If the measurement system is unreliable, the capability study becomes meaningless.
This is why companies perform MSA (Measurement System Analysis) — to verify whether the measurement system can consistently produce accurate and repeatable measurements.
Without a trustworthy measurement system, capability metrics cannot be trusted either.
Mean and Standard Deviation
Before understanding capability indices, we need two basic statistical concepts.
Mean
The mean is simply the average of all measurements. It tells us where the process is centered.
Standard Deviation
The standard deviation measures variation. In simple terms:
- A small standard deviation means measurements stay close together.
- A large standard deviation means measurements are widely spread out.
This is extremely important because customers do not only care about averages. A process may have a perfect average value while still producing defective parts if the variation is too large.
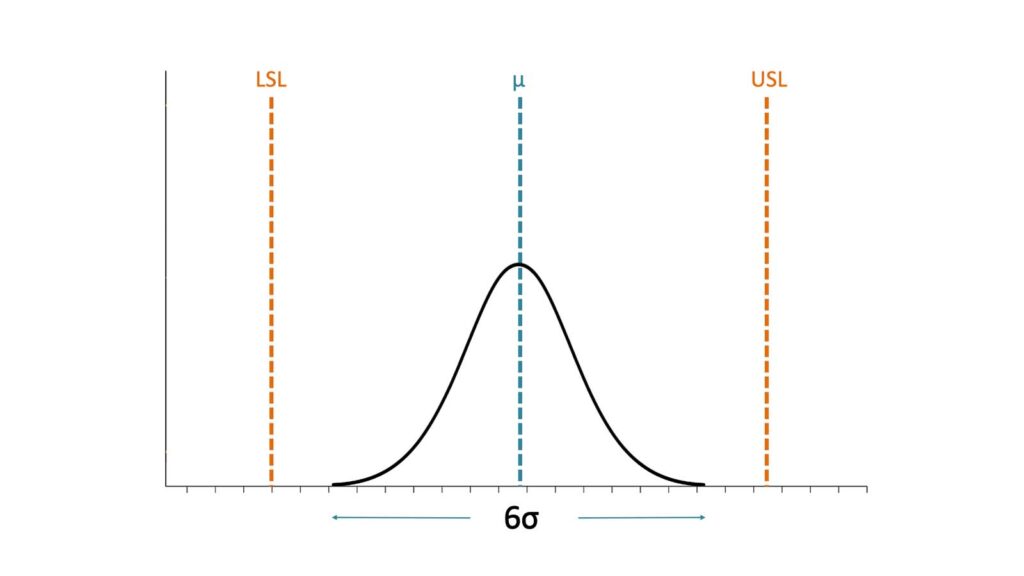
Cp: Potential Process Capability
Cp measures how wide the specification range is compared to the natural spread of the process. The calculation assumes that nearly all measurements from a stable process fall within plus and minus three standard deviations from the mean — commonly called the “six sigma spread.”
Cp = (USL − LSL) / 6σ
Where:
- USL − LSL represents the specification width
- 6σ represents the process spread
If Cp < 1
The process variation is wider than the specification range. Defects are unavoidable.
If Cp > 1
The process variation is smaller than the specification range. This is better — but Cp alone does not guarantee a capable process.
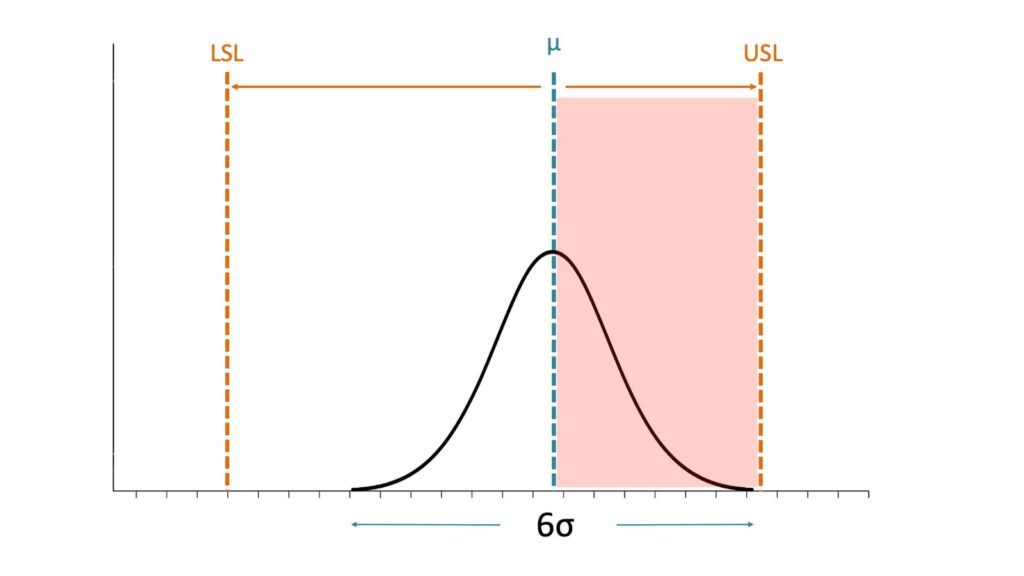
The Limitation of Cp
Cp assumes the process is perfectly centered between the specification limits. It does not care whether the process average is drifting toward one side. This means a process could already be producing defects while Cp still appears acceptable.
Cp still answers this important question: “If the process were perfectly centered, how capable could it potentially be?”
Cpk: Actual Process Capability
Cpk measures the actual capability of the process, including how well the process is centered.
Cpk = min( (USL − μ) / 3σw , (μ − LSL) / 3σw )
Cpk evaluates the distance between the process mean and the upper limit, and the distance between the process mean and the lower limit — then selects the worse side.
- In a perfectly centered process: Cp = Cpk
- As the process shifts away from center: Cpk becomes smaller than Cp
Mathematically, Cp will always be greater than or equal to Cpk. This makes sense because Cp assumes ideal centering, while Cpk reflects reality.
Difference Between Cp and Cpk
Cp
Potential capability
Assumes perfect centering.
Cpk
Actual capability
Includes process centering and real-world behavior.
This is why customers usually care much more about Cpk.
Typical Customer Requirements on Cpk
| Cpk | Defect Rate (%) | PPM |
|---|---|---|
| 1.00 | 0.27 | 2,700 |
| 1.33 | 0.0063 | 63 |
| 1.67 | 0.000054 | 0.54 |
| 2.00 | 0.000000197 | 0.002 |
Different industries have different expectations, but common targets include:
- Cpk ≥ 1.33 — Generally acceptable for stable production processes
- Cpk ≥ 1.67 — Often required for critical or new processes
- Cpk < 1.00 — Usually considered incapable
Capability metrics are only meaningful if the process is stable. Interestingly, if a process has a very high Cpk but still experiences defects, that often indicates issues outside normal process variation, such as measurement problems, special causes, assembly issues, human errors, or external factors.
Pp and Ppk: Long-Term Performance Metrics
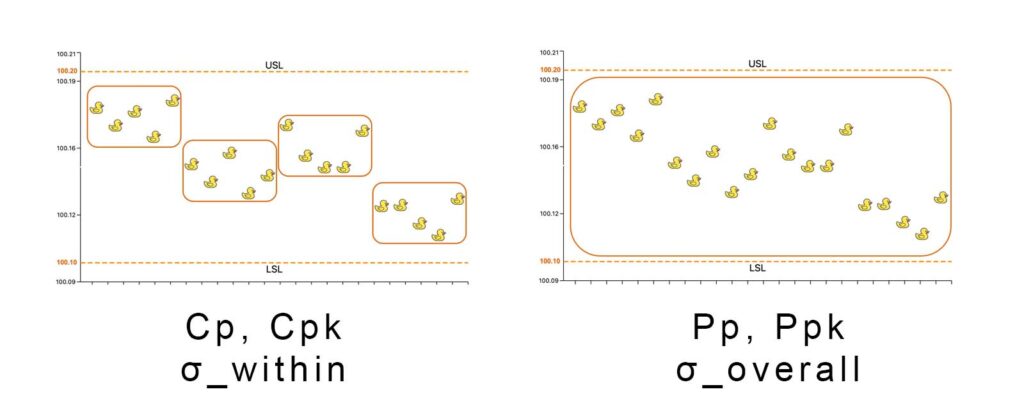
At first glance, Pp and Ppk look very similar to Cp and Cpk. The formulas are almost identical. The major difference is how standard deviation is calculated.
- Cp and Cpk use σwithin (within-subgroup standard deviation)
- Pp and Ppk use σoverall (overall standard deviation)
Ppk = min( (USL − μ) / 3σo , (μ − LSL) / 3σo )
Short-Term vs Long-Term Variation
Cp and Cpk — Short-Term Capability
Cp and Cpk use within-group standard deviation. The data is divided into logical subgroups — for example, 5 consecutive parts, 10 parts measured within one hour, or parts from the same mold cavity.
Within each subgroup, conditions are usually similar: same machine, same operator, same material batch, same environment. This allows Cp and Cpk to focus mainly on short-term natural variation.
As a result, Cp and Cpk are considered short-term capability metrics.
Pp and Ppk — Long-Term Performance
Pp and Ppk do not use subgrouping. They calculate standard deviation using all measurements together — this is called overall standard deviation.
This means long-term effects directly influence the variation:
- machine drift,
- operator differences,
- material changes,
- environmental shifts,
- setup variation.
Because of this, Pp and Ppk are considered long-term performance metrics. They often represent what the customer actually experiences over time.
Long-term variation is usually larger than short-term variation. Therefore:
- Pp is often lower than Cp
- Ppk is often lower than Cpk
If Cp and Cpk look excellent but Pp and Ppk are much lower, this usually indicates the process changes significantly over time and may not be as stable as it initially appears.
Final Thoughts
Process capability analysis is not just about formulas. It is about understanding how reliably a process can meet customer expectations over time.
The key takeaways:
- Cp measures potential capability
- Cpk measures actual capability
- Pp measures long-term process performance
- Ppk measures long-term actual performance
And perhaps most importantly: a good capability study starts with a reliable measurement system and sufficient data. Once these foundations are in place, capability analysis becomes an extremely powerful tool for predicting quality performance, reducing defects, and improving customer confidence.